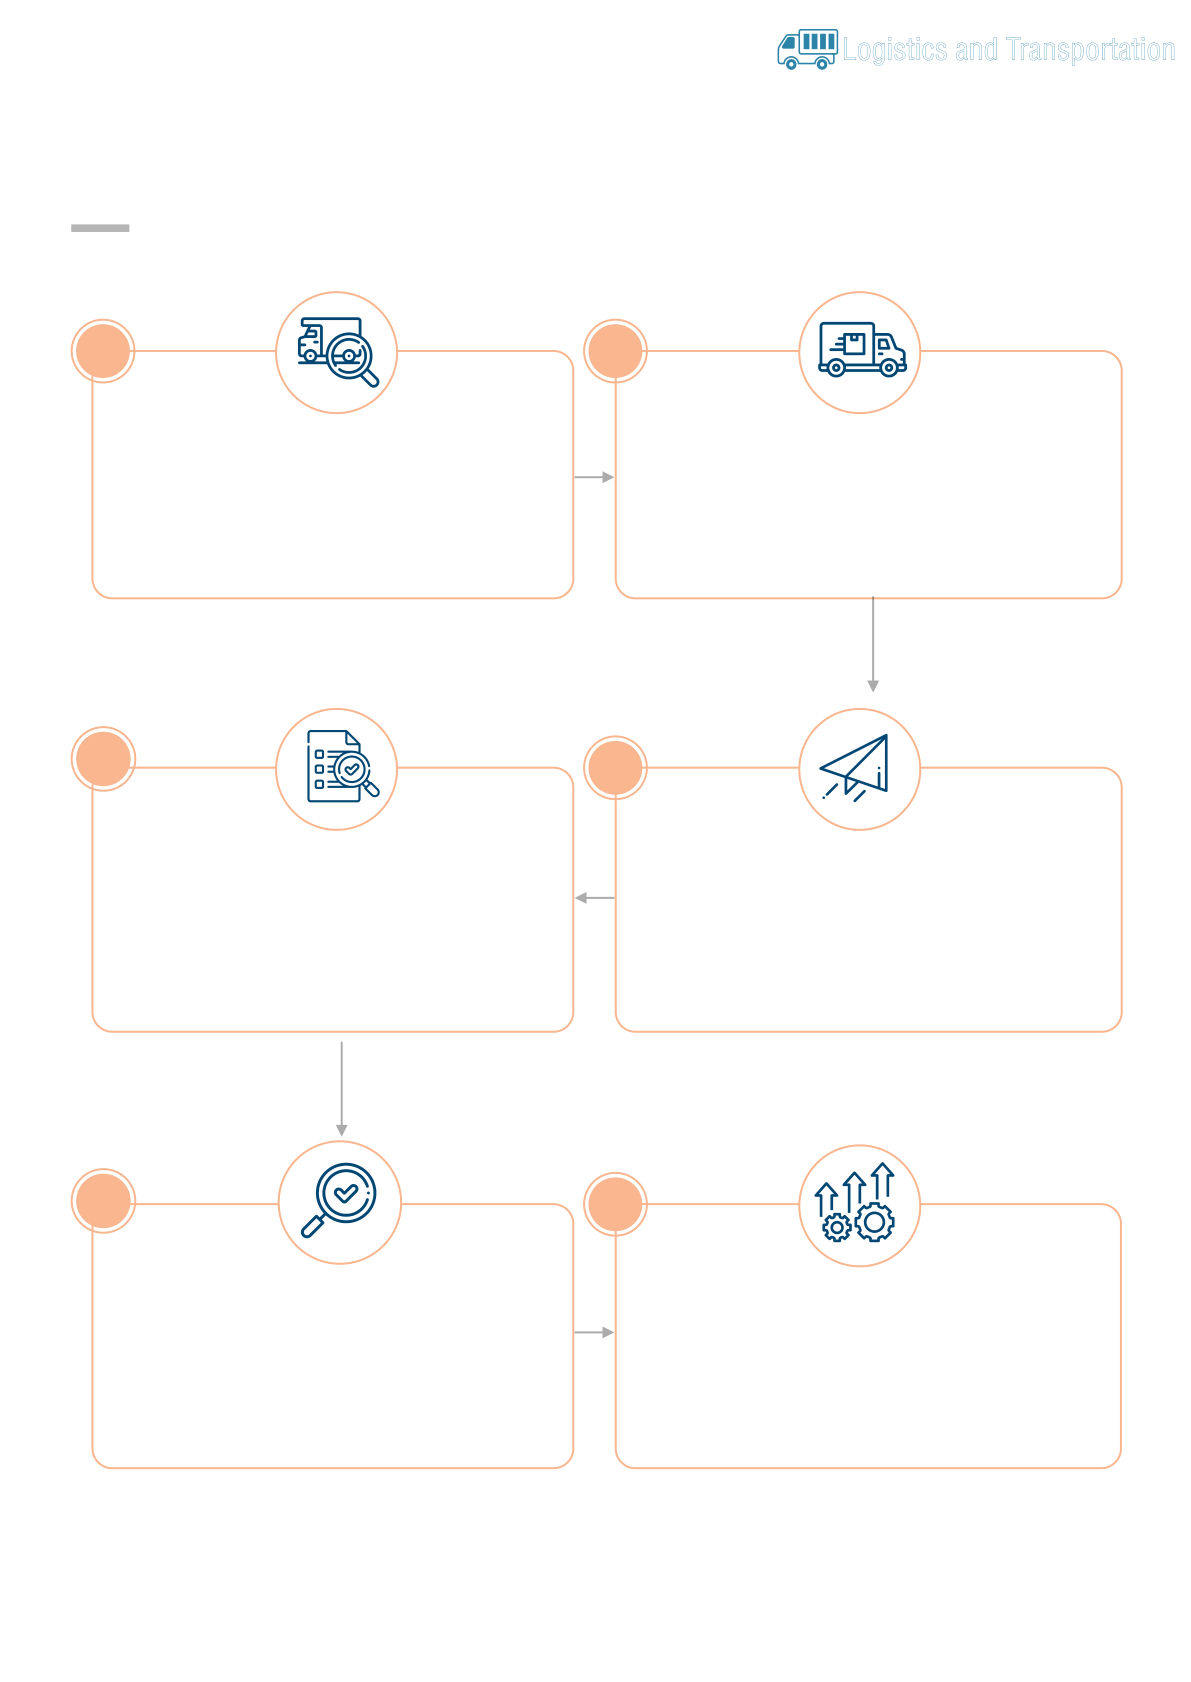
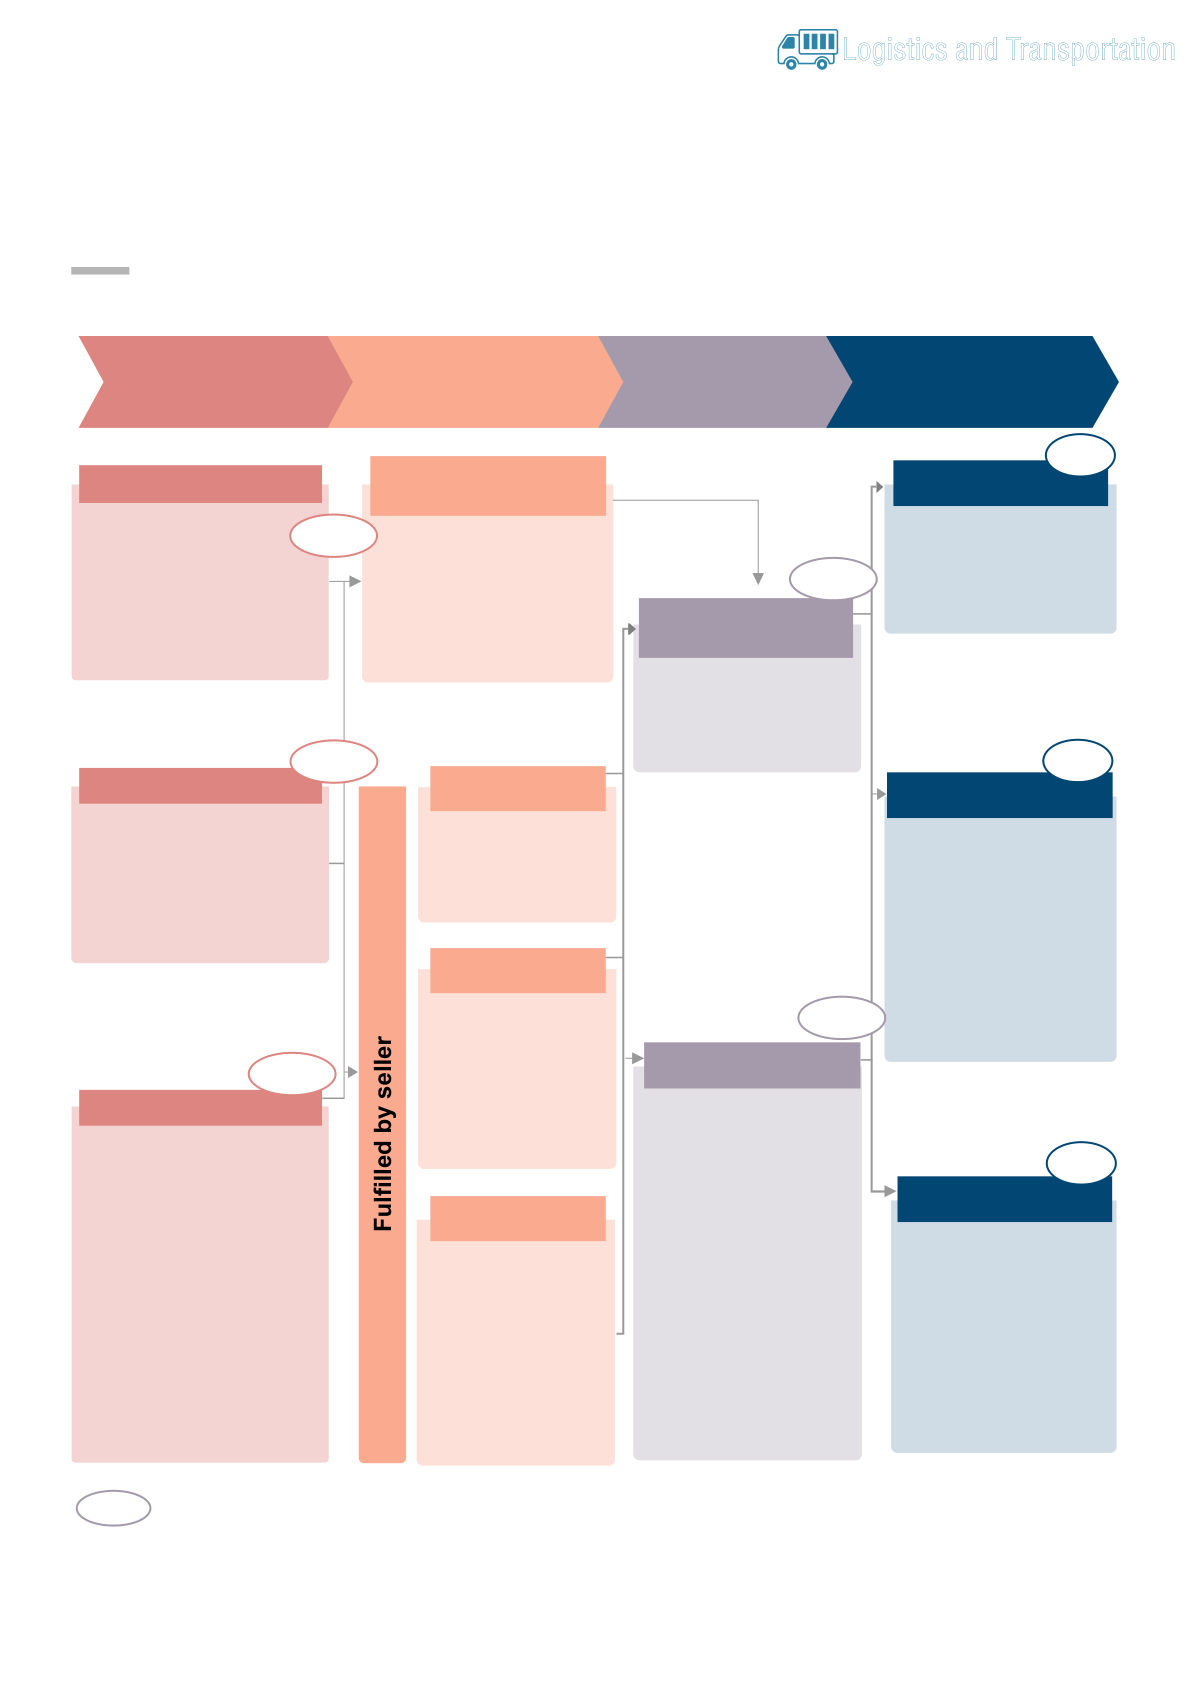
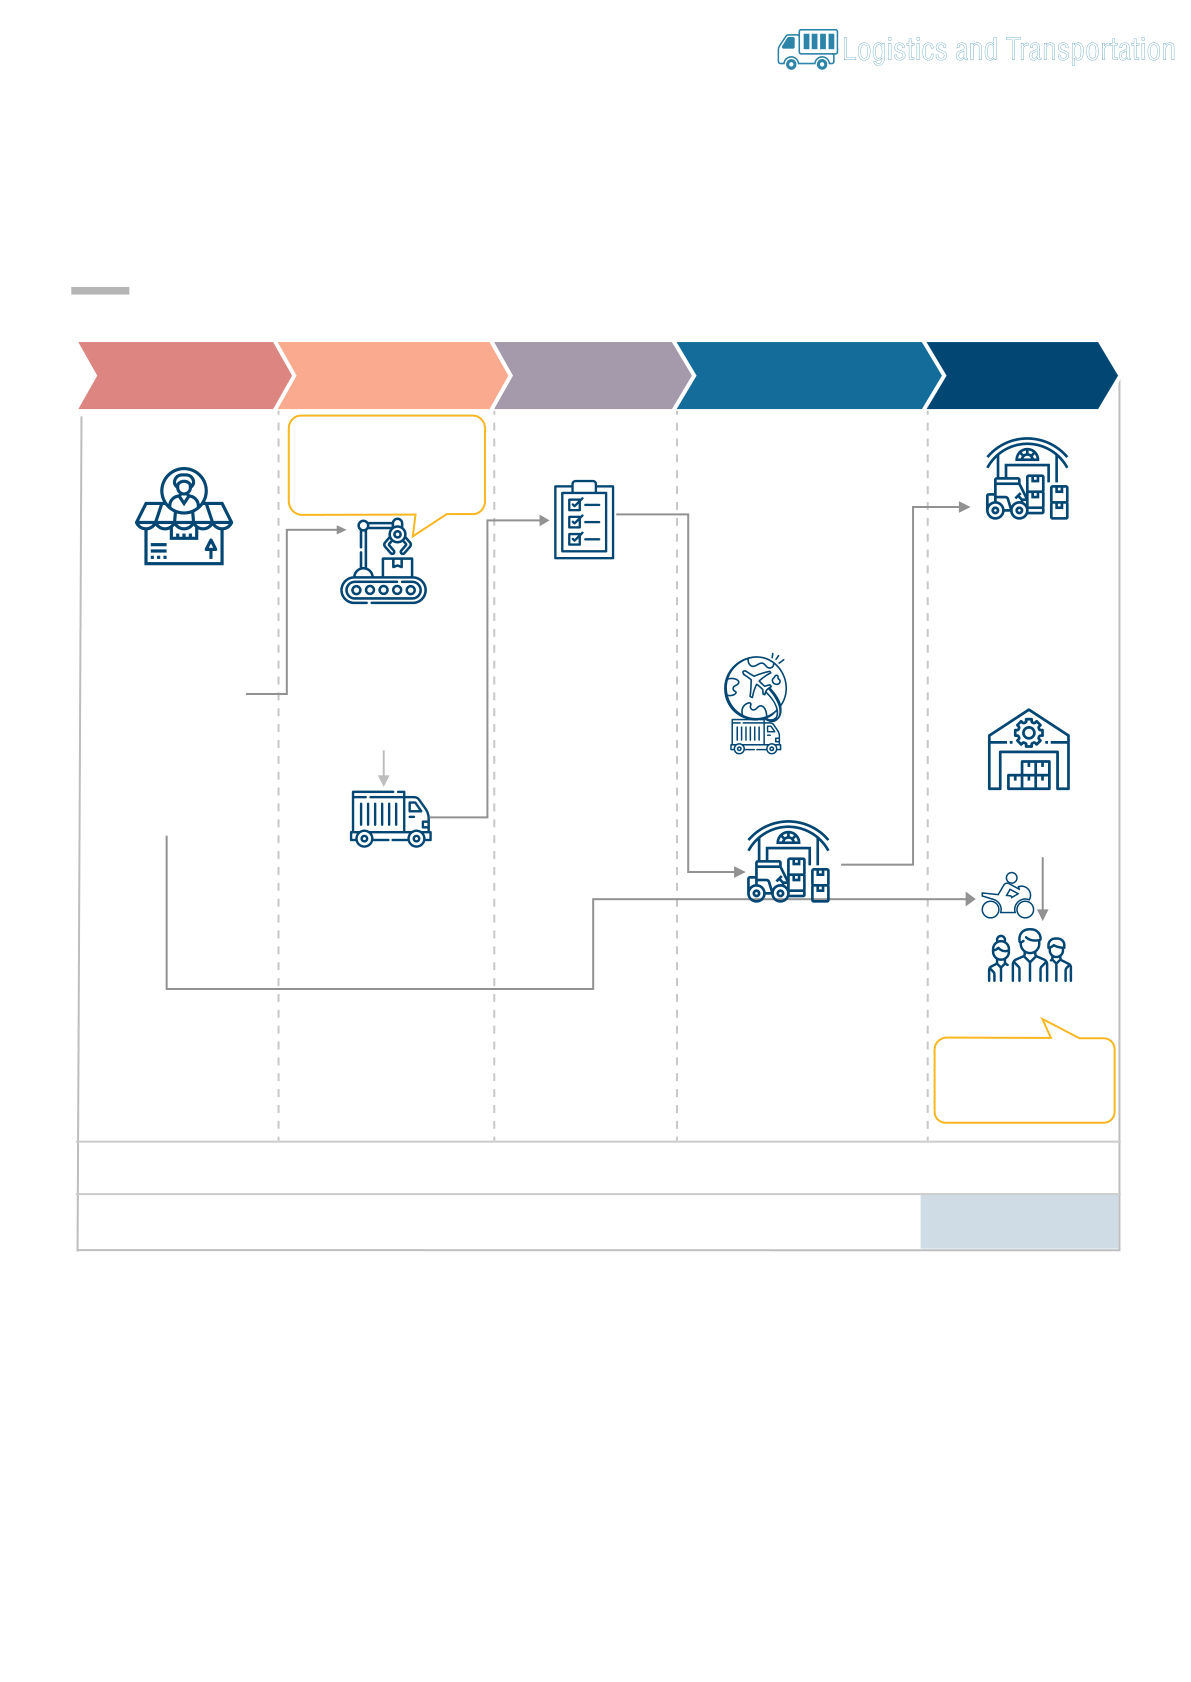
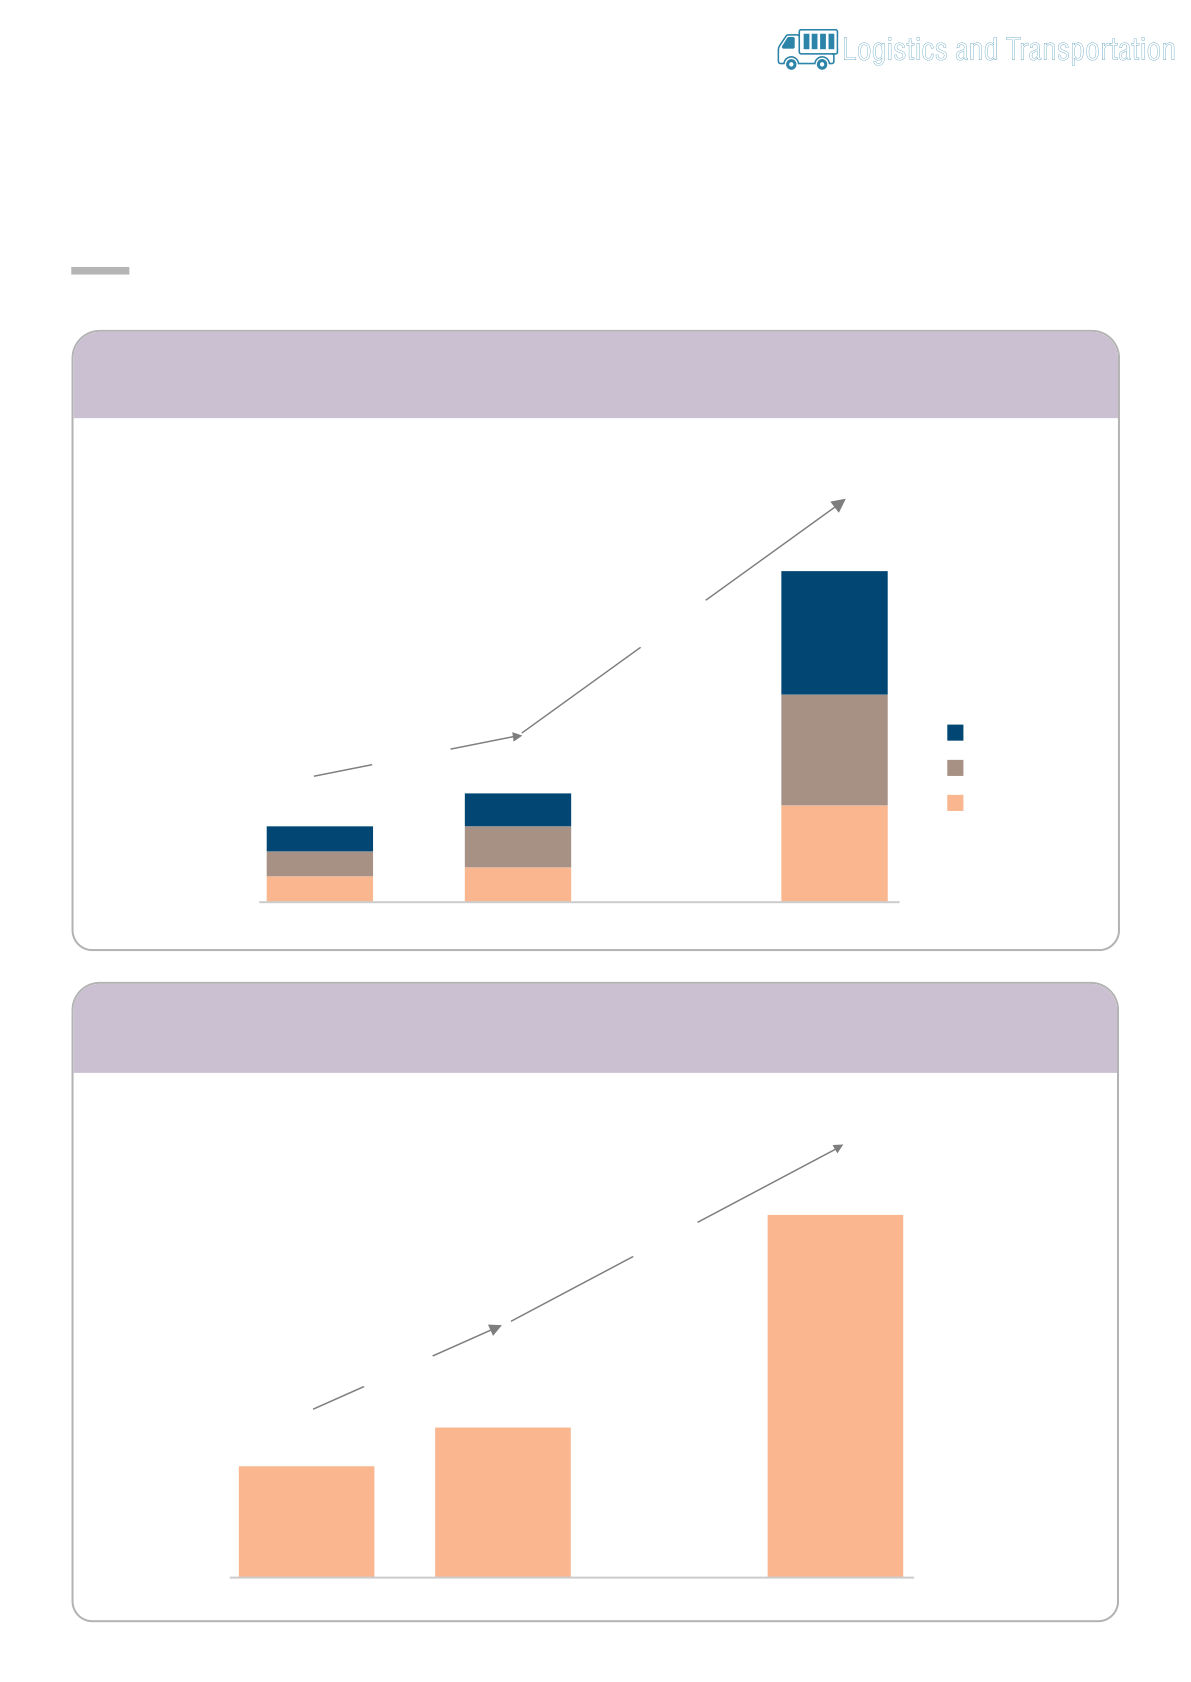
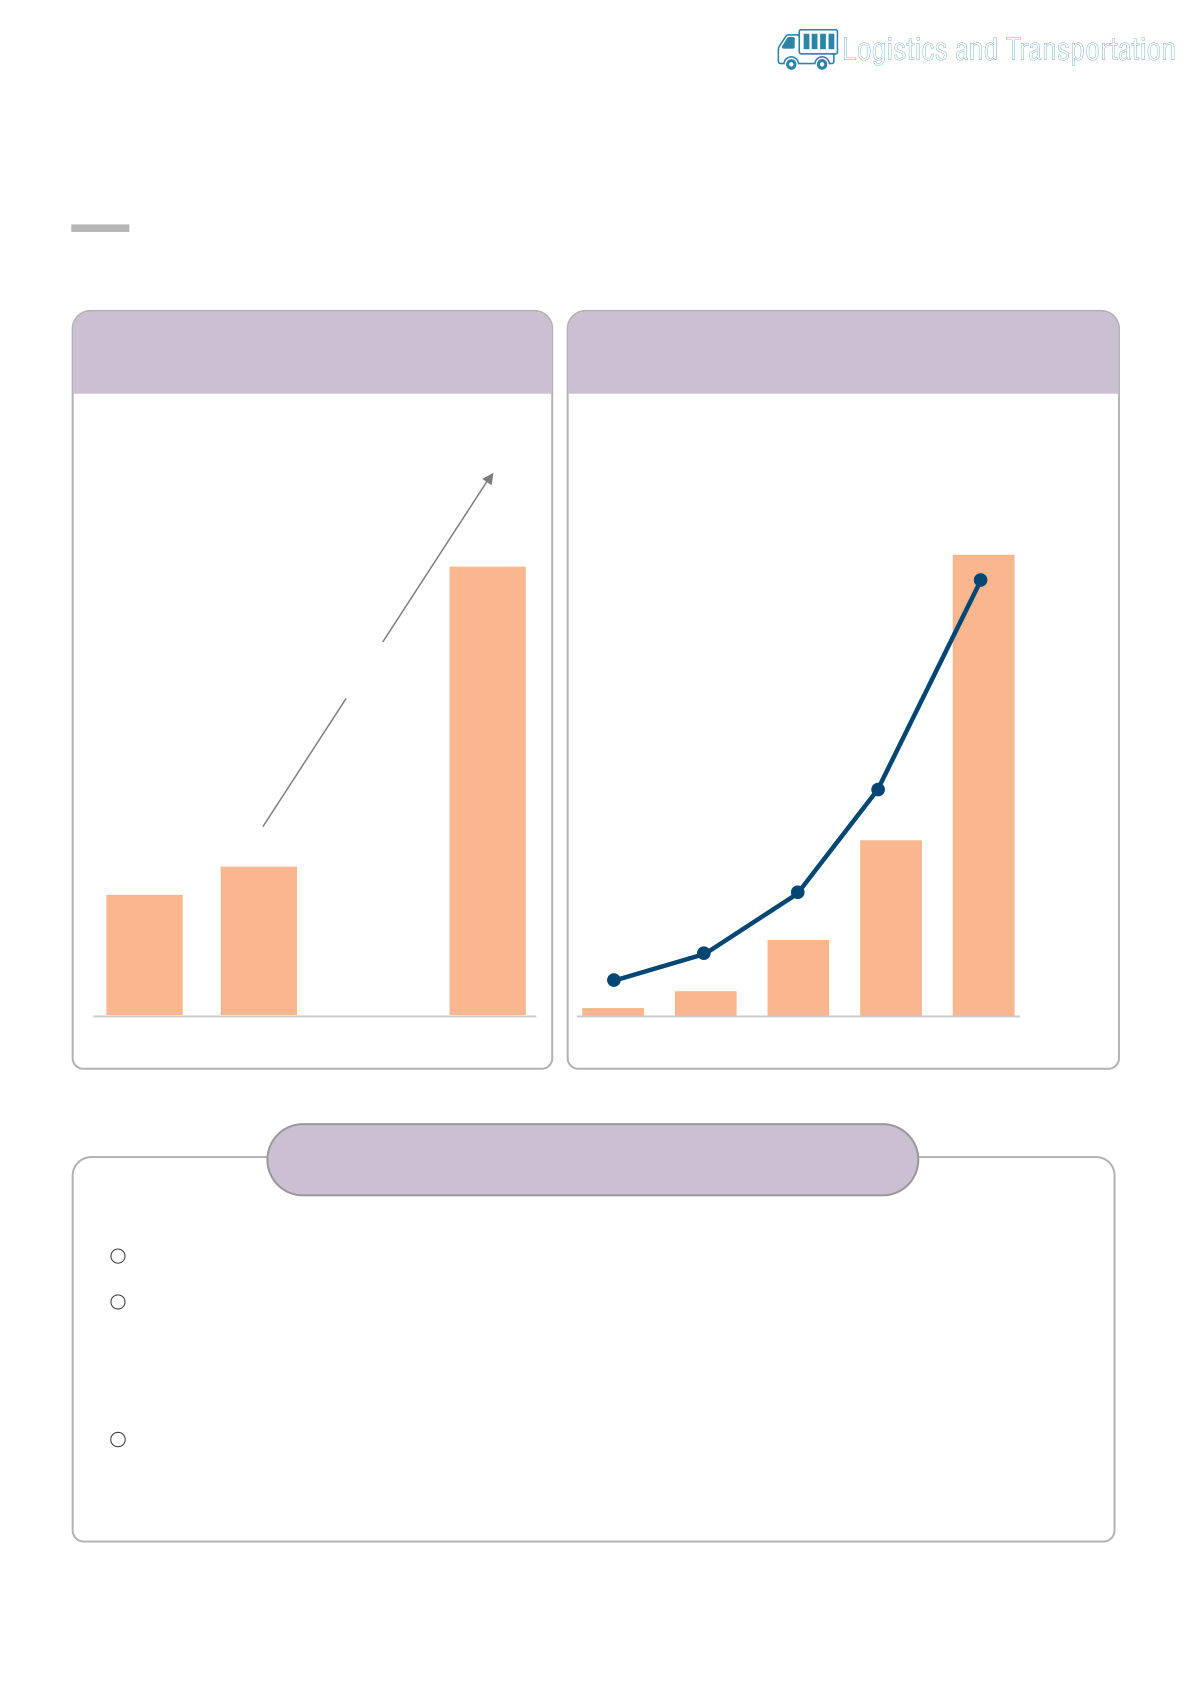
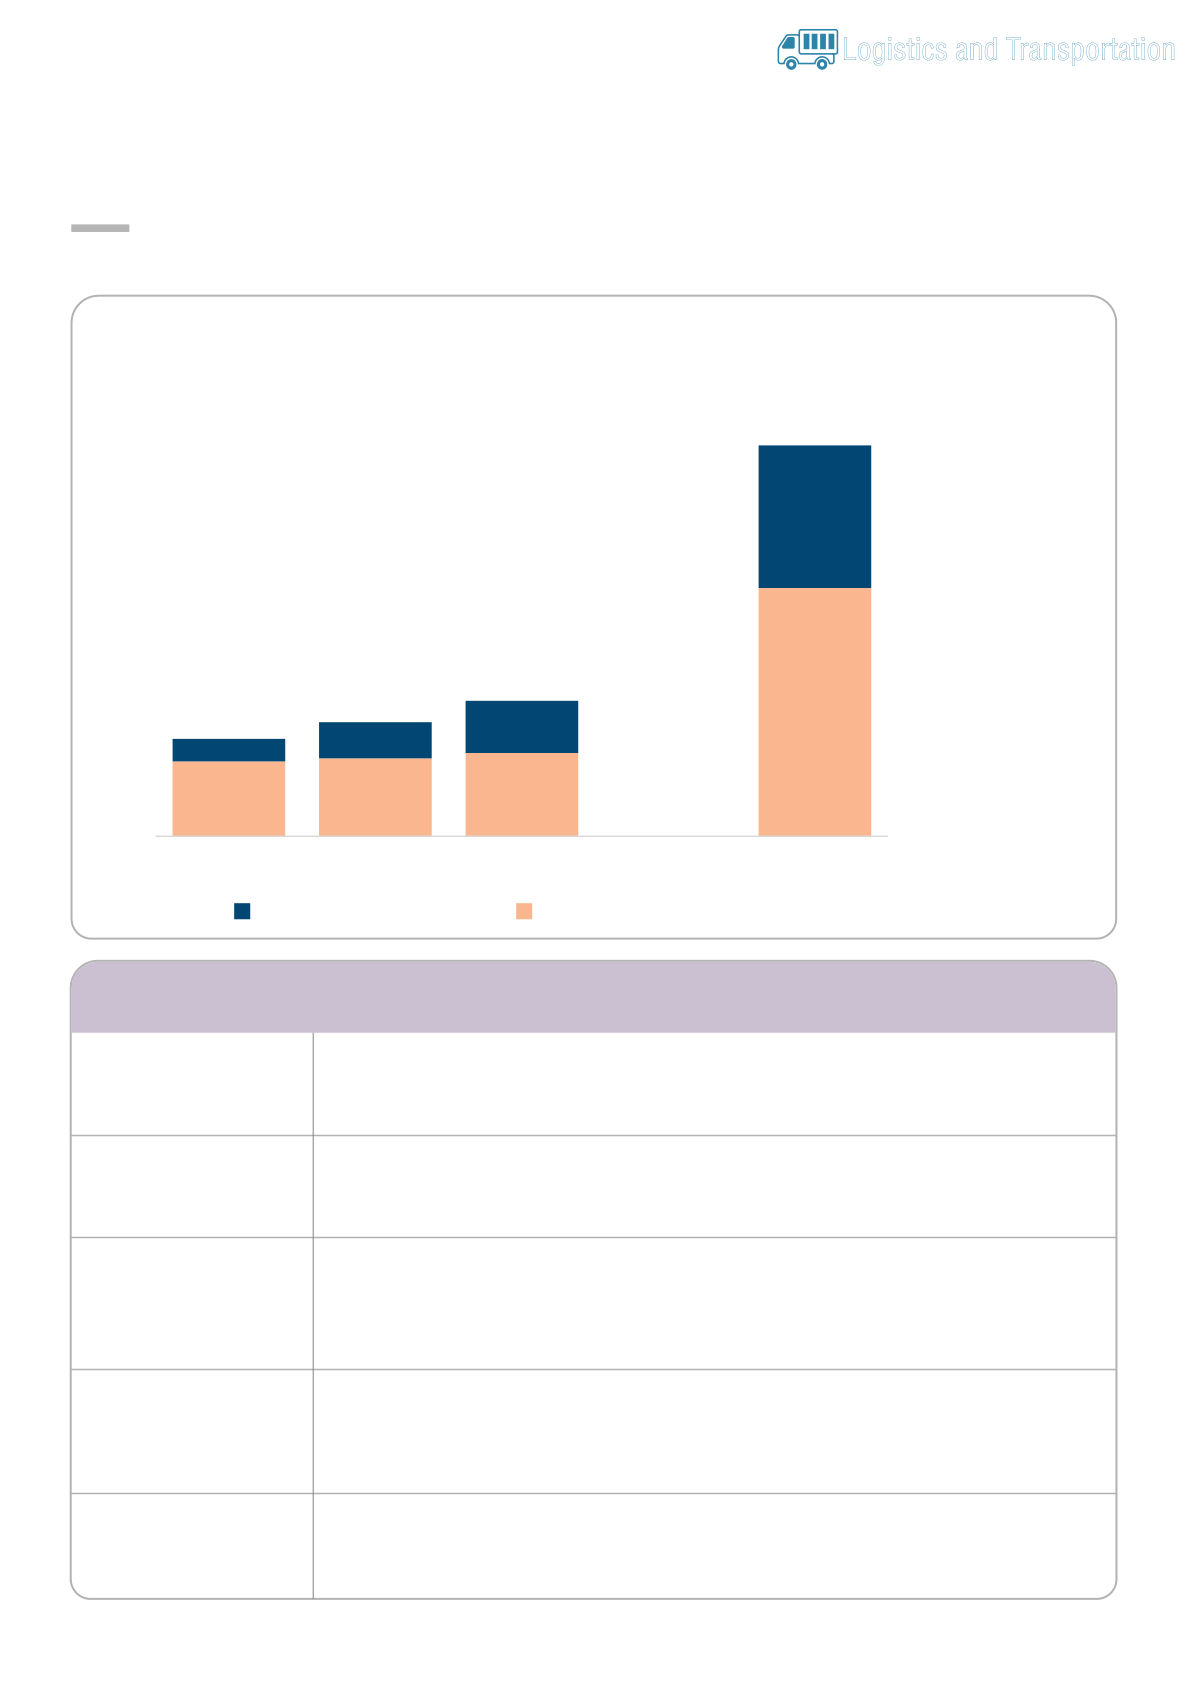
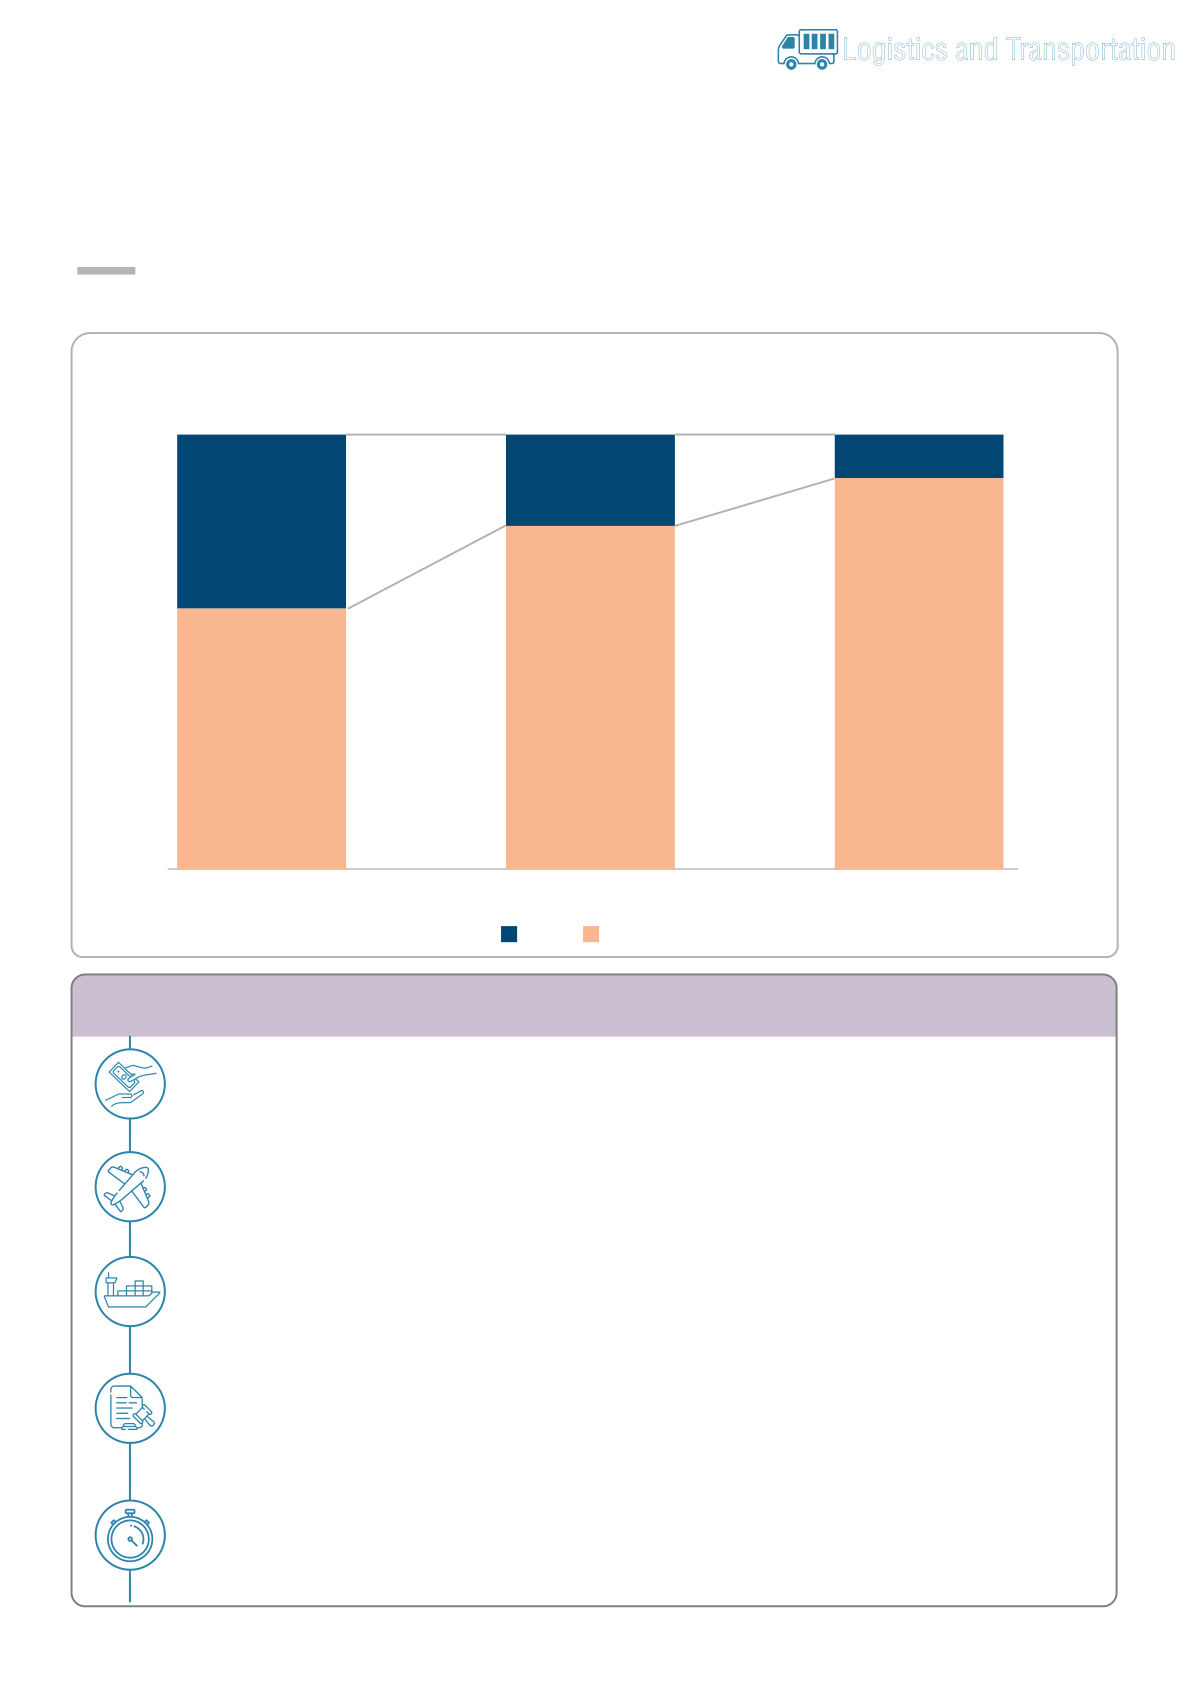
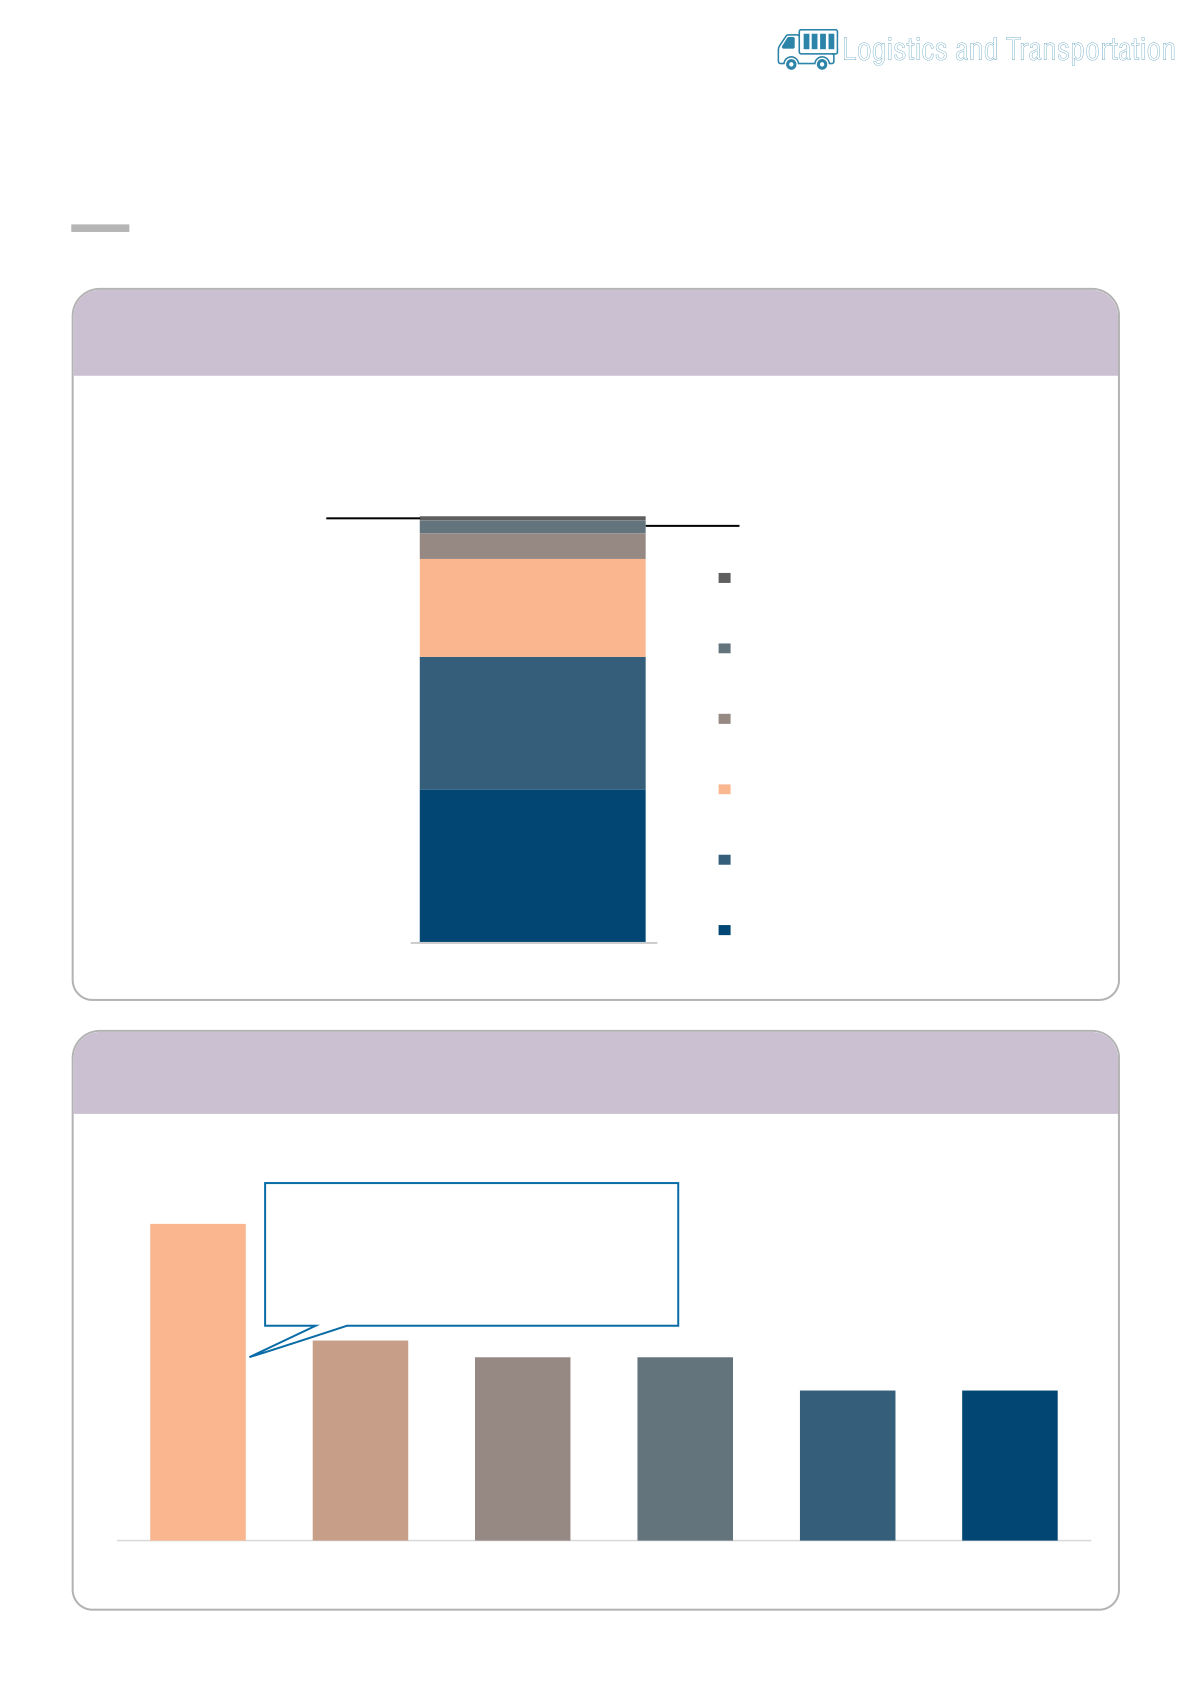
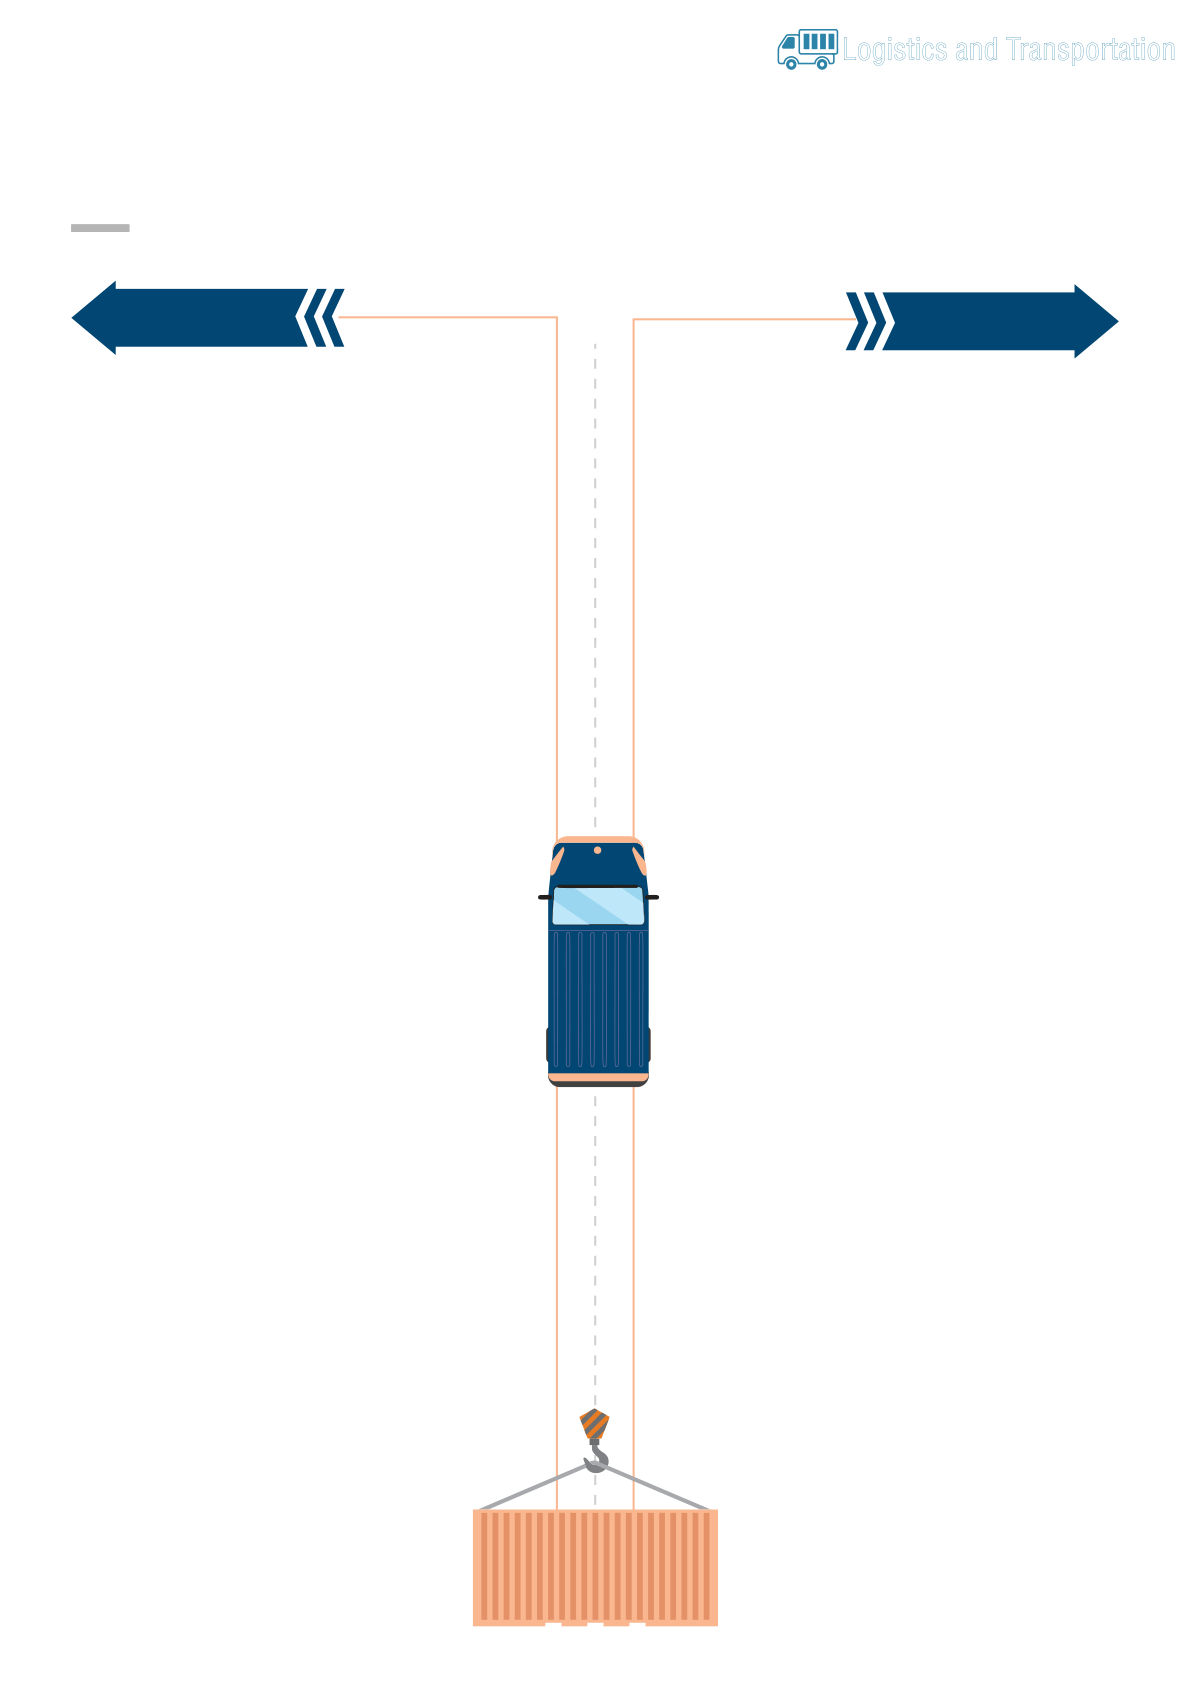
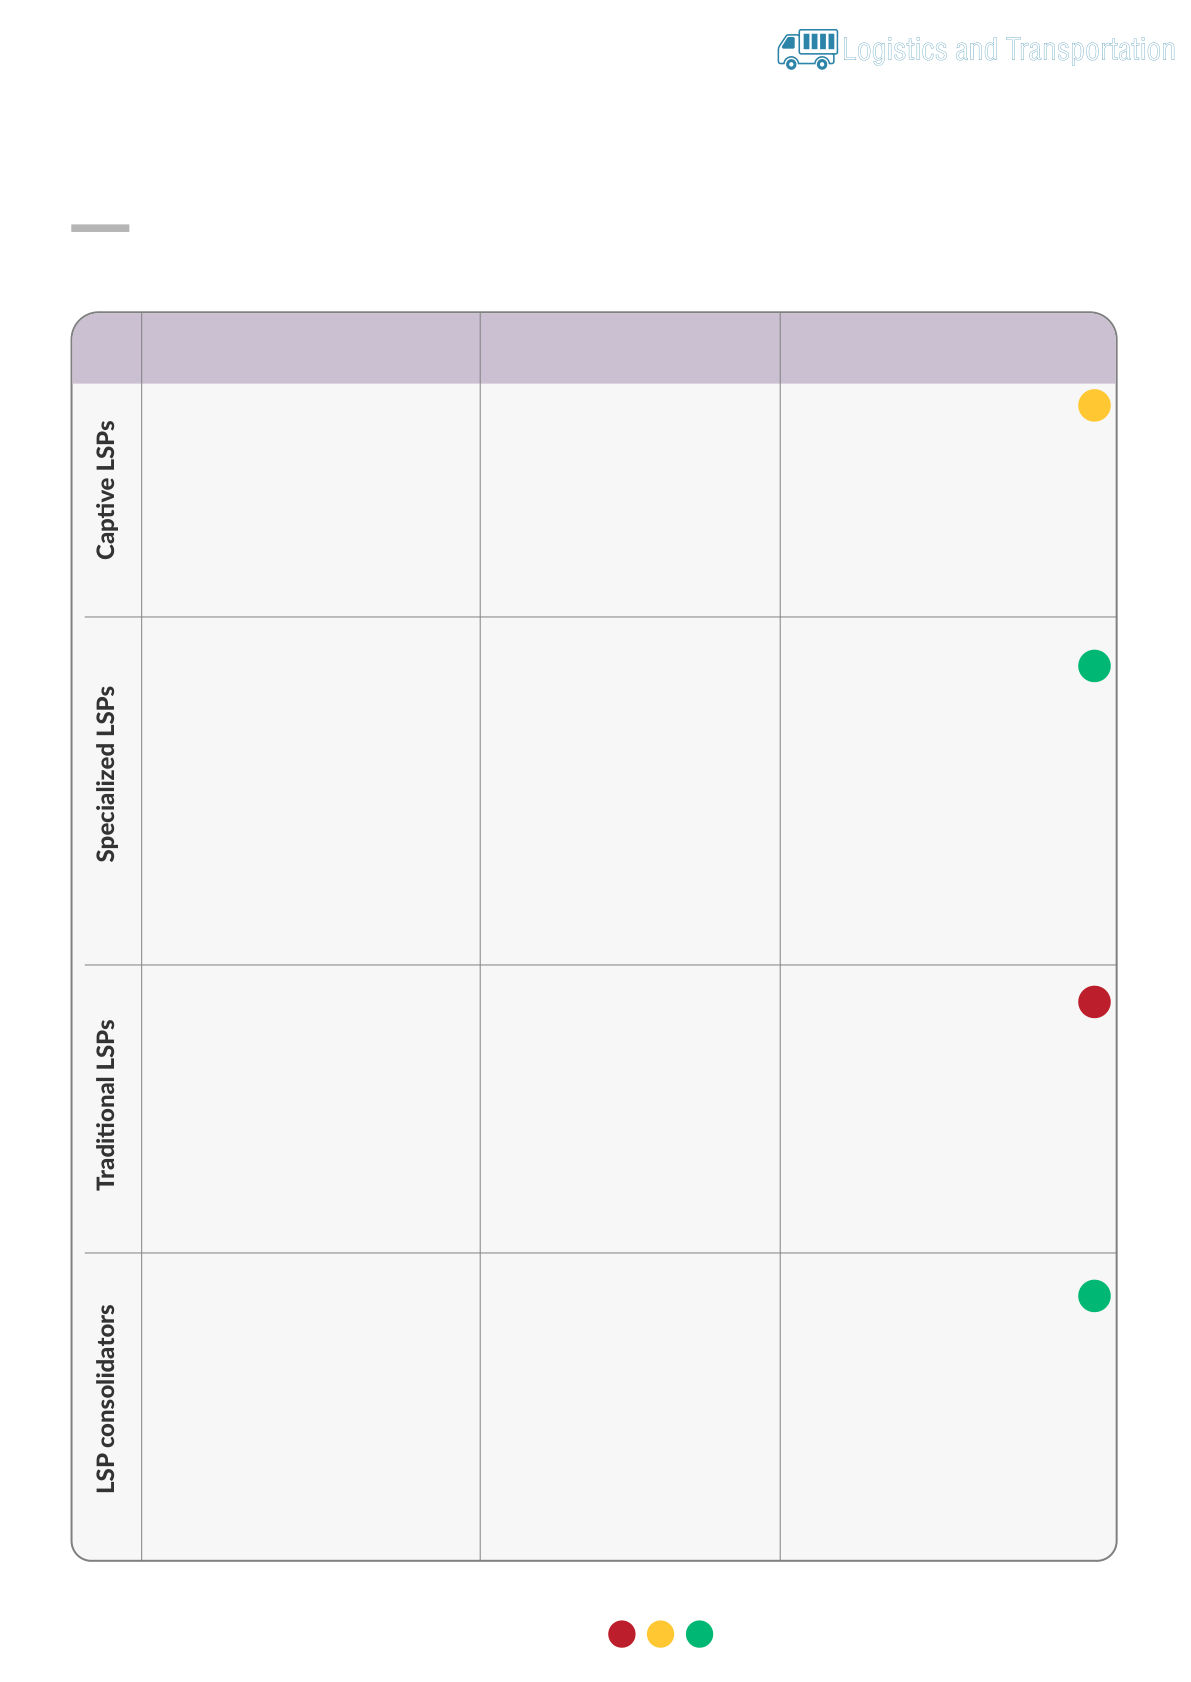
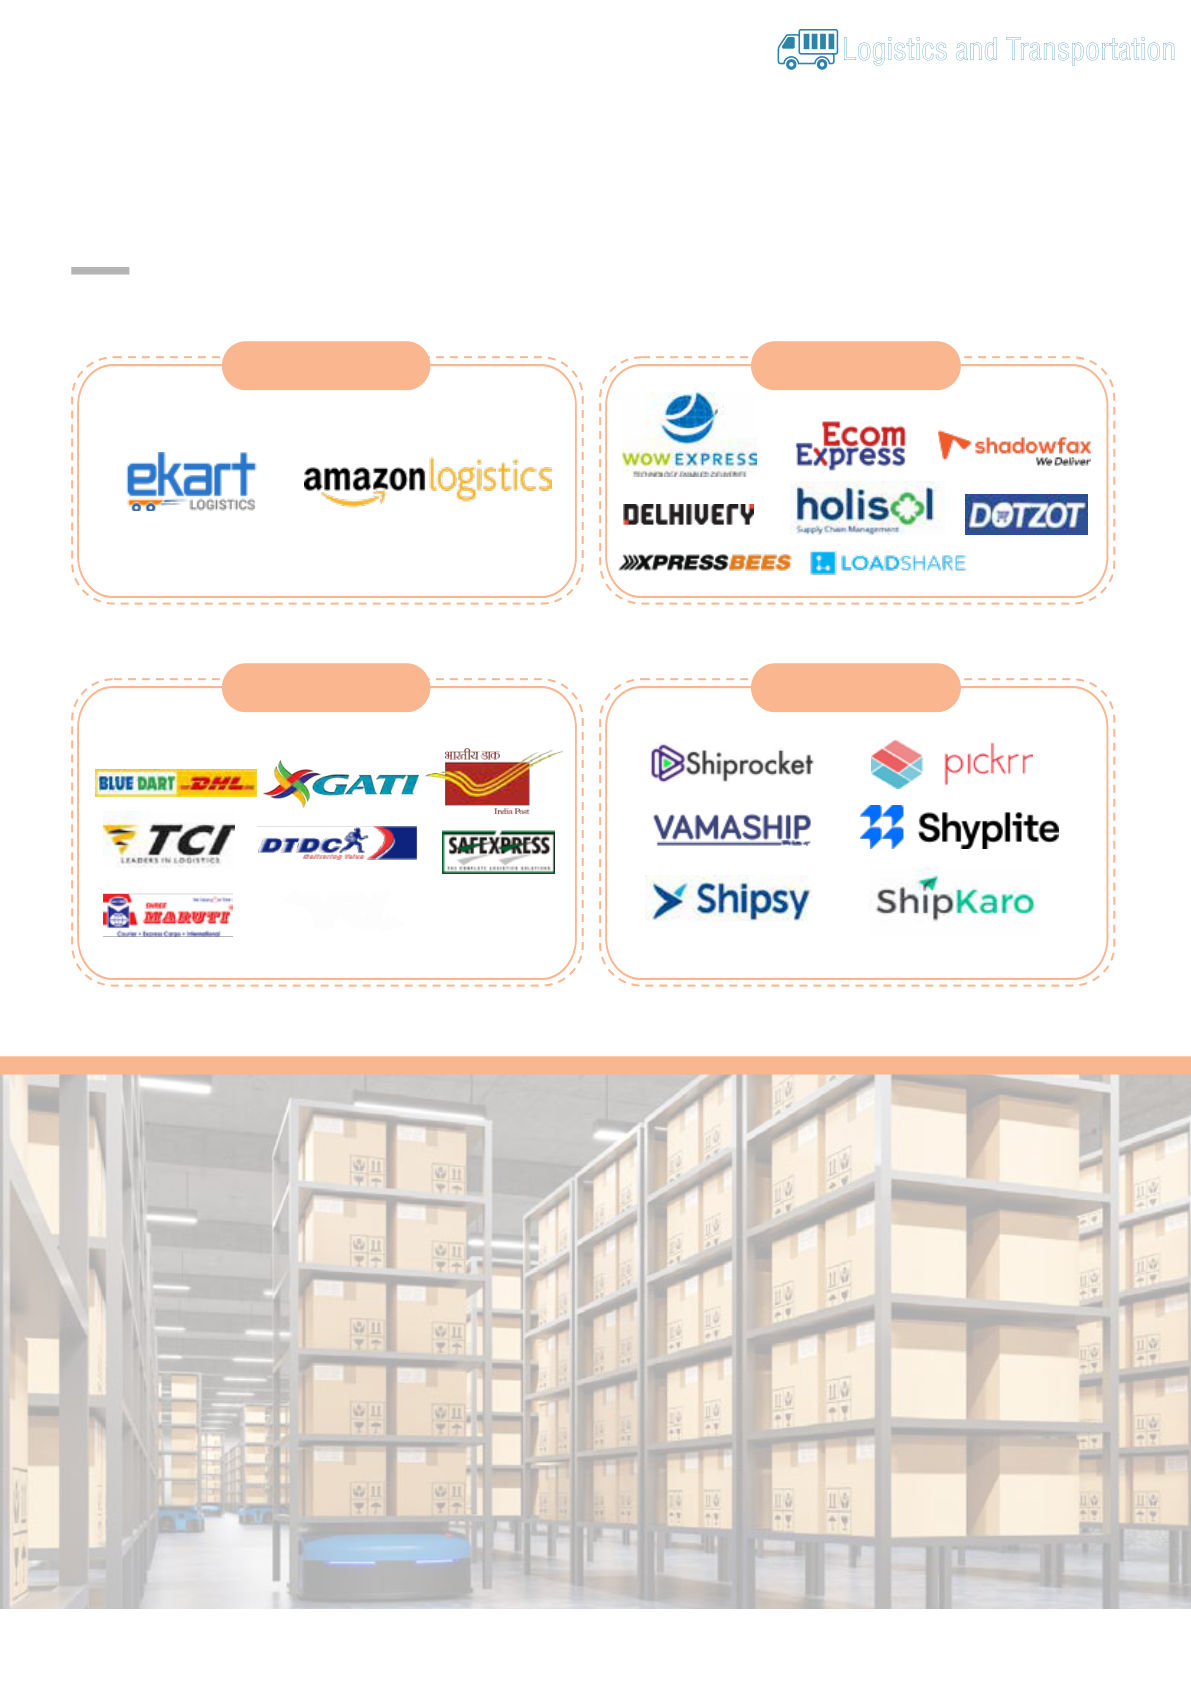
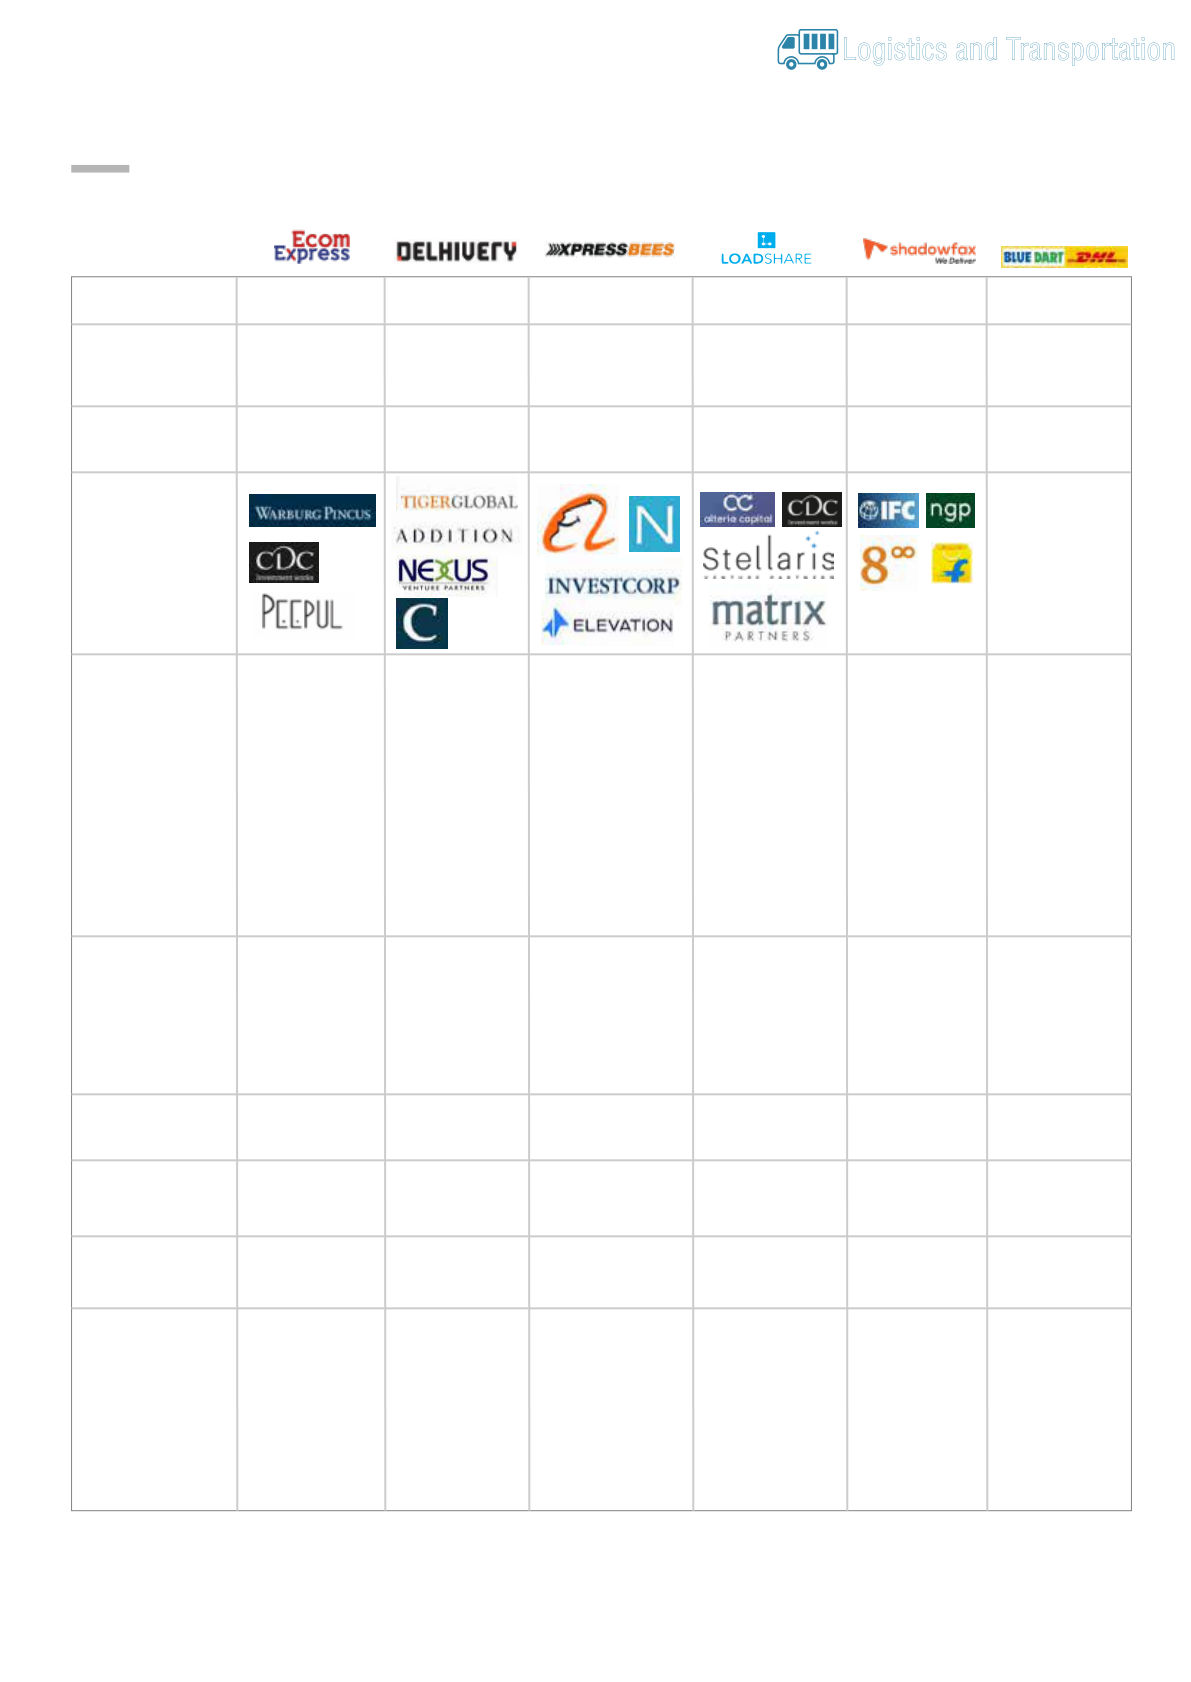
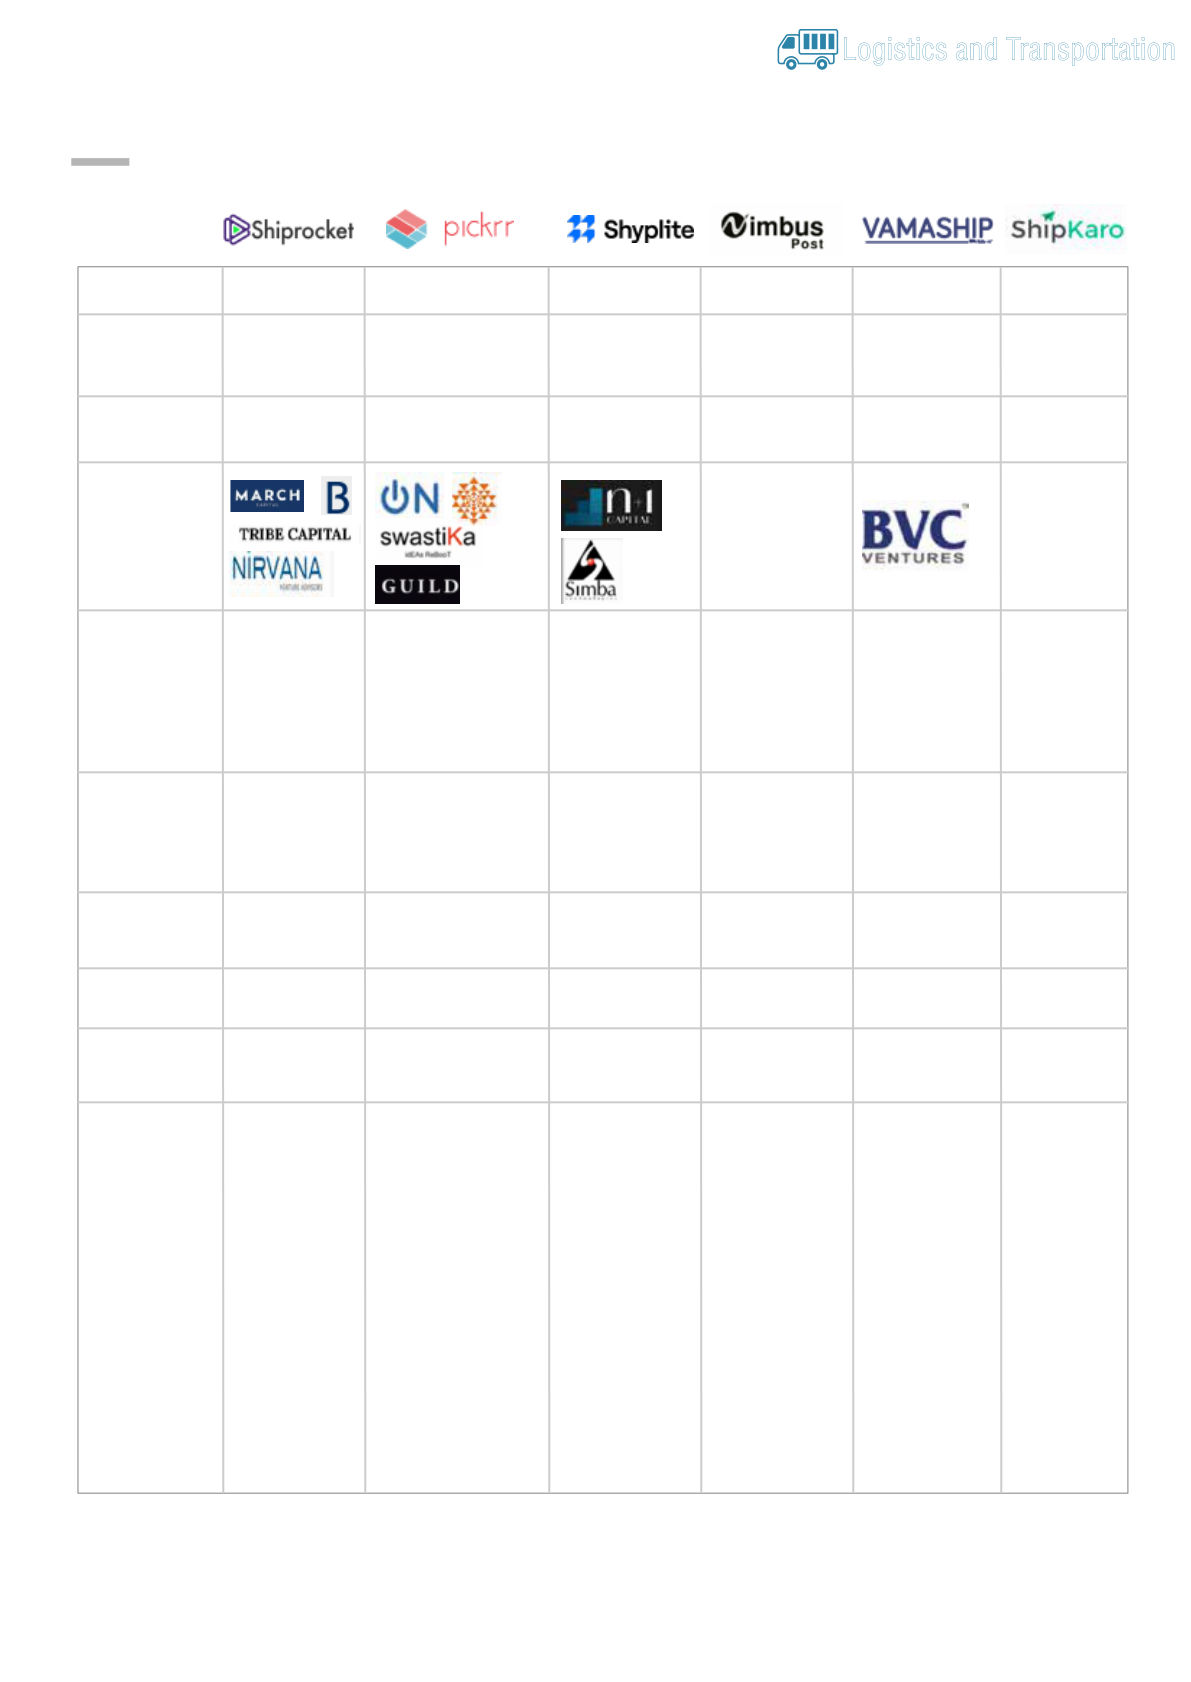
Logistics and Transportation LOGISTICS INDUSTRY Report JUNE 2022 Confidential and proprietary © PGA Labs Foreword India’s e-commerce market is huge and fast-growing. Close to 100 percent of pin codes in India are witnessing e-commerce adoption. Many of these transactions and orders come from tier two cities and smaller towns. The growing e-commerce sector is positively influencing the growth of the e-commerce logistics market in India. This growth will also pose several challenges for e-commerce logistics in India. Online-focused players are partnering with third-party logistics (3PL) providers to manage delivery, inventory, packaging, shipping, warehousing, and tracking issues. More than 60% of the e-commerce logistics market is outsourced, providing headroom to specialized logistics service providers (LSPs) and consolidators; expected to grow at a CAGR of 24% till FY26. The overall Indian e-commerce retail logistics market is expected to reach US$ 6.3B in FY26. This report aims to provide various industry stakeholders, including business leaders, an overall perspective on the market. The situation is evolving rapidly, and some expected scenarios might have slight variations. The report reflects our perspectives as of March 2022. We look forward to continuing the discussion with our friends across sectors and exchanging notes. Abhishek Maiti Director GLOSSARY Acronyms Description LSP Logistics service providers D2C Direct-to-consumer COD Cash on delivery SaaS Software as a service OTP One time password SME Small and medium size enterprise GST Goods and Services Tax QC Quality check © PGA Labs | 03 Logistics and Transportation Key takeaways • Indian e-commerce retail logistics market is expected to grow at an of CAGR 24% to reach US$ 6.3B in FY26 from US$ 2.2B in FY21, driven by strong growth in the e-commerce retail market • COVID-19 has accelerated the adoption of online purchases resulting in significant demand and supply-side changes in the e-commerce space • Tier-2 & below cities are witnessing high growth in shipment by volume, comprising 46% of shipments in CY20 from 25% in CY15, thus leading to Etailers requiring logistics partners that can provide reach and scale • More than 60% of the e-commerce logistics market is outsourced, providing headroom to specialized logistics service providers (LSPs) and consolidators; expected to grow at a CAGR of 24% till FY26 • The proliferation of D2C brands and social commerce will be key drivers of growth; these segments have specific needs which can be catered to by LSPs • Specialized LSPs have reached a certain scale while consolidators are gradually building capabilities to create a differentiated value proposition • Consolidators provide a compelling value proposition to small and medium Etailers with their relatively lower pricing compared to specialized LSPs; additionally, they provide an array of logistics service provider choices to Etailers that meet their needs and deploy technology to provide analytics-based offerings and visibility throughout the end-customer journey (post-checkout) • Infrastructural inefficiencies, high return rate, and COD orders are key challenges for LSPs in reducing the overall e-commerce retail logistics cost in India © PGA Labs | 04 Logistics and Transportation Executive summary Indian e-commerce retail logistics market is expected to grow at a CAGR of 24% to reach US$ 6.3B in FY26 from US$ 2.2B in FY21; e-commerce logistics growth will be driven by the e-commerce retail market, which is expected to reach a size of approx. US$ 145B by FY26, with approx. 15M daily shipments • Increased internet penetration is driving online purchases; internet penetration in India reached approx. 50% in 2020 from 20% in 2018 • Consumers are shifting towards digital platforms; the number of smartphone users is expected to reach 859M by CY22 • Demand from tier 2 & 3 cities driving growth for e-commerce; approx. 46% of the total shipments were from tier 2 & below cities in CY20 from 25% in CY15 • Growth in infrastructure with the significant addition of warehousing capacity • Government initiatives to boost infrastructure development, implementation of GST, and introduction of e-way bills • COVID-19 has accelerated the adoption of online purchases resulting in significant demand and supply-side changes in the e-commerce space • Globally, there are proven business models of players catering to the e-commerce logistics industry as specialized logistics service providers (LSPs) and consolidators More than 60% of the e-commerce logistics market is outsourced, providing headroom to specialized logistics service providers (LSPs) and consolidators; expected to grow at a CAGR of 24% till FY26 • Amazon logistics services and Ekart have expanded capacity over the years; however, with the expansion of the overall market, there is a significant opportunity for non-captive logistics players to establish market presence • The proliferation of D2C brands and social commerce will be key drivers of growth; these segments have specific needs which can be catered to by LSPs • Tier-2 & below cities are witnessing high growth in shipment by volume, comprising 46% of shipments in CY20 from 25% in CY15, thus leading to Etailers requiring logistics partners that can provide reach and scale © PGA Labs | 05 Logistics and Transportation Specialized LSPs have reached a certain scale while consolidators are gradually building capabilities to create a differentiated value proposition • Specialized LSPs such as Delhivery, Xpressbees, and Ecom express have been able to achieve a certain scale while others such as Loadshare and Shadowfax are in the process of scaling up • Players are adopting differentiated strategies in terms of value proposition, geographic coverage • Among consolidators, Shiprocket, Pickrr, and Shyplite are relatively more established players in the market with a portfolio of service offerings • Consolidators provide a compelling value proposition to small and medium Etailers with their relatively lower pricing compared to specialized LSPs; additionally, they provide an array of logistics service provider choices to Etailers that meet their needs and deploy technology to provide analytics-based offerings and visibility throughout the end-customer journey (post-checkout) Cost pressures due to infrastructural deficiencies in the logistics sector is one of the key considerations • India faces high logistics costs as compared to developed countries driving e-commerce logistics firms to switch to surface transit for deliveries • The Indian logistics industry is plagued by a lack of proper infrastructure for both air and surface transit leading to inefficiency, longer transit times, higher logistics costs, and higher returns Return shipments lead to an additional cost factor in overall logistics cost • In addition to the infrastructural inefficiencies, the cost of deliveries is driven up high return rate and a high share of Cash on Delivery (COD) orders • Currently, the return rate for overall e-com retail is around 18-25%, driving up the logistics cost • The returned goods lead to the refund, exchange, and replacement, increasing overall supply chain cost Value proposition of consolidators is expected to mature and be established with time as they build capabilities to create differentiation • Consolidators being primarily used by small and medium businesses based on the need for better pricing and access to a wider set of LPSs to meet customized needs • Larger customers with higher volumes and better negotiation power are typically seen to use a mix of consolidators and specialized LSPs • As volumes increase, customer service levels in terms of complaint response times and efficient dispute resolution seem to be adversely impacted • Standalone SaaS players do not seem to have much traction at this point; customers prefer players that combine a marketplace model along with technology-led offerings • With specialized LSPs and consolidators targeting D2C brands and social commerce platforms, consolidators need to build differentiation in terms of coverage, larger LSP aggregation, and technology platform for Etailers to manage the end customer journey © PGA Labs | 06 Logistics and Transportation E-commerce platforms choose a Logistics Service Provider (LSP) basis multiple factor such as needs and expertise 1 2 Identifies need Gathers information Analyses company’s logistics needs according to the Considers various logistics service providers according products, volume, services, and geography in which to the necessary expertise and service quality required product is to be delivered to handle logistics services 4 3 Evaluates LSPs Requests quotations Receives quotations and analyses the best fit Sends requests for quotations to various LSPs who can according to criteria such as – area of delivery, fulfill the needs of the e-commerce platform delivery cost, lead time, payment terms, IT capability, flexibility etc. 5 6 Finalises LSP On-going relationship Confirms partnership with best suited LSP Assesses the service levels of the LSP and if satisfactory, continues business relationship with the LSP & LSP subsequently manages the entire process Sources: PGA Labs analysis © PGA Labs | 07 Logistics and Transportation E-commerce retail logistics market landscape has evolved to include specialized LSPs and consolidators, while large Etailers have developed their captive LSPs Fulfilment Logistics service Demand generation Shipping platform model/shipper provider 58% Fulfilled by Ecom Horizontals(¹) Captive retailer 80-84% • In-house arms of • Shipper is e-commerce • E-commerce businesses e-commerce platforms retailer 70-75% that offer products across that provide logistics a wide range of categories services Directly through • Products are shipped by Etailer to customer LSPs • Shipper directly chooses a LSP without any intermediary 23% 15-18% D2C & Vertical Own brand Specialized LSPs(²) • D2C (Direct to • Seller supplies to • 3rd party logistics Consumer), companies the customer service providers that that have own directly partner with e-commerce platforms to e-commerce sell products platforms and Procured consolidators to provide logistics 25-30% services • Seller procures from wholesaler Consolidators 2% or manufacturer and supplies to New age commerce the customer • Enables Etailers (predominantly small New age commerce 19% & medium-sized) to includes platforms such as: Traditional LSPs choose a preferred Dropship • Social network for LSP for shipments shopping • Traditional logistics • Seller places • Combines shipping service providers that • Reselling platforms orders with the orders from multiple have started wholesaler or Etailers to generate • Video livestream providing e-commerce manufacturer who volume commerce logistics services supplies to the • Group buying platforms customers directly xx% - Market share (by Value) Notes: Horizontals = E-commerce businesses that offer products across a wide range of categories; (2) e-commerce focused logistics service providers © PGA Labs | 08 Sources: PGA Labs analysis Logistics and Transportation E-commerce logistics value chain has sequential steps with handoffs; line-haul and last-mile delivery constitute more than 80% of the total delivery cost First mile Fulfilment Processing / Last mile Line haul delivery logistics centres sorting Quality check and sorting done when products are received • Connecting main from seller supply centre with the main demand centre • Dispatch and (mother hubs) via shipment of surface or air products from • Products are stored mother hub to at warehouses of • Quality check, • Based on the 10% by air the delivery Etailers, or packaging and delivery location, hubs of LSPs labelling of the processing or • Completely product based on sorting is done at packaged, labeled the order received the mother products by sellers, warehouse of Transferred directly LSPs or dedicated 90% by surface to warehouse or to sorting centers the customer • Shipped out to delivery centers • Transferred to sorting center or mother house of LSP • Main demand centre (mother hub of LSPs) • End customers Return rate for overall e-com retail is around 18-25% E-commerce retail transportation cost 40-45% 5-10% 2-5% 45-50% Notes: LSPs – Logistics service providers Sources: PGA Labs analysis © PGA Labs | 09 Logistics and Transportation LSPs have focused on large and medium e-commerce players, while logistics consolidators provide a cost-effective platform to small and medium players Value proposition Enablers • Focus on infrastructure and coverage • Cater to time-sensitive shipments, enabled by technology enabling more control over the supply chain • Setting up fulfillment centers and sorting centers pan-India Captive • Ensure service levels as demanded by e-commerce players • Onboard extended service delivery partners LSPs or Kirana store partners for last-mile • Cater to complex categories such as delivery furniture, jewelry, etc. • Focusing on nuances of e-commerce • Focus on a technology-first approach deliveries like handling COD orders, • Significant investment in building a full return pickups, OTP confirmations etc. technology stack Specialized • Cater to time sensitive deliveries, also • Smartphone penetration coupled with providing cost effective options LSPs internet infrastructure supporting use of • Options to provide services for tech-based initiatives end-to-end delivery or servicing any specific zone as per the requirement • Presence of delivery center and pickup • Established network coupled with centers across the country, preferred for experience and expertise Traditional placing orders offline • Building capability in express logistics LSPs • Service reliability is high as compared to new entrants • Cost-effective way for small and medium • Combining shipping orders from multiple players to transport goods since they SMEs to generate volume have relatively lower volume • Better price points negotiated with LSPs • Provide additional services other than LSP • Provide an integrated view of options to logistics to Etailers like handling Etailers in terms of logistics partners consolidators payments, customer queries, tracking services, etc. • Technology platform for data analytics and visibility across the end customer journey • Provide options to integrate with e-commerce platforms and marketplaces seamlessly Sources: PGA Labs analysis © PGA Labs | 10 Logistics and Transportation E-commerce logistics growth is underpinned by the retail e-commerce market, which is expected to reach a size of US$ 145B by FY26 E-commerce retail market size in India is expected to become US$ 145B in FY26 from US$ 48B in FY21 E-commerce retail market (US$ B) 145.0 CAGR 25% 54.1 Amazon CAGR 48.6 Flipkart 20% 47.5 Others 33.0 14.5 11.0 18.0 42.2 10.9 15.0 11.1 FY20 FY21 FY26P Daily shipment volumes are expected to reach 15M in FY26 from 6M in FY21 E-commerce daily shipments volume (M) 15.0 CAGR 19% CAGR 16% 6.2 4.6 FY19 FY21 FY26P Source: PGA Labs analysis © PGA Labs | 11 Logistics and Transportation LSP consolidators are expected to derive growth from the proliferation of D2C brands and social commerce Social commerce market in India is expected to D2C market in India is expected to grow grow at a CAGR of 164% at a CAGR 25% D2C market in India Retail social commerce market in India CAGR US$ B, CY19-25 US$ B CY 20-23 164% 5.5 100 6.1% Social commerce as % of total e-commerce CAGR market 25% 3% 2.1 33 1.7% 27 0.9 0.7% 0.3% 0.3 0.1 CY19 CY20 CY25F CY19 CY20 CY21P CY22P CY23P Growth drivers for LSP consolidators • Rise in long-tail Etailer will boost the growth of LSP consolidators • Rise in D2C brands: • 600+ D2C brands have been launched since 2016 • D2C startups have raised US$ 2B funding in the last 8 years • Rise of social commerce platforms: • Social commerce startups raised US$ 550M+ in the first 7 months of 2021 Source: PGA Labs analysis © PGA Labs | 12 Logistics and Transportation Indian e-commerce retail logistics market is expected to grow at 24% CAGR to reach US$ 6.3B in FY26 E-commerce retail logistics market CAGR CAGR US$ M, FY19-26 FY19-21 FY21-26 18% 24% 6,317 52% 22% 2,307 2,187 5% 24% 4,010 1,843 1,572 842 584 363 1,209 1,259 1,345 FY19 FY20 FY21 FY26P Insourced shipments Outsourced shipments Increasing internet penetration, demand in Tier 2 cities are the key growth drivers Increasing internet • Increased internet penetration is driving online purchases penetration • Internet penetration in India reached 50% in 2020 from 20% in 2018 • Consumers are shifting towards digital platforms Shift in consumer • # smartphone users are expected to reach 859M by CY22 behavior • Demand from tier 2 & 3 cities driving growth for e-commerce Increasing demand from Tier 2 & Tier 3 • 46% of the total shipments were from tier 2 and below cities in CY20 from 25% in cities CY15 • Grade A & B warehouses grew at CAGR 18% between FY18-20 Infrastructure • Amazon and Flipkart increased their storage capacity at a CAGR 42% and 37% growth respectively between CY16-21 • Government initiatives to boost infrastructure development, implementation of GST, Government and introduction of e-way bills have driven the e-commerce logistics market in India initiatives Sources: World Bank, Press reviews, Secondary research, PGA Labs analysis © PGA Labs | 13 Logistics and Transportation Dominant e-commerce retail platforms are investing in building their captive logistics arms to increase capacity, expand reach and ensure speed to market Growth trends • Investments by dominant e-commerce retail platforms to increase capacity, expand reach and Captive ensure speed to market logistics • Preference in complex and/or high-value shipments such as jewelry and furniture arms • Improved efficiency through tie-ups with external client • The top 2 players (Amazon and Flipkart) and Furniture (Pepperfry) have the scale or need to maintain captive arms other players are expected to use LSP services Specialized • Etailer will continue to outsource to e-commerce focussed LSPs as in-house costs of captive LSPs arms is higher, for example ATS (Amazon Transportation Services) is 8-10% higher than the cost of outsourcing to e-commerce focussed LSPs • Traditional LSPs have also started providing e-commerce focused services in order to stay Traditional relevant LSPs • Separate division to handle B2B and B2C players • Modal shift towards surface transport leading to emergence of technology focused players focusing on both cost and time reduction Overall • GST is enabling players to achieve economies of scale • Adoption of ‘Hub and Spoke’ warehousing model would increase the efficiency of the systems Sources: World Bank, Press reviews, Secondary research, PGA Labs analysis © PGA Labs | 14 Logistics and Transportation E-commerce retail logistics has seen a shift towards surface mode driven by cost considerations and improved surface transit time E-retail logistics revenue split by mode %, FY18-20 10% 21% 40% 90% 79% 60% FY16 FY18 FY20 Air Surface Cost pressure and improved surface transit time is driving the shift towards surface mode Airline haul is 3-4X costlier than the surface line haul, however, has a lower transit time In addition to the infrastructural inefficiencies, the cost of deliveries is driven up by factors like high return rate, a high share of Cash on Delivery (COD) orders Infra development: Surface infrastructure has significantly improved over last few years, driven by some government plans like Bharatmala, DFC and Sagarmala Implementation of GST: Removal of paperwork, multiple tax processing, and associated clearances that have resulted in faster transit time (saving 5-7 hours of transit time). Improved predictability and higher efficiencies LSPs have started surface express movements for dedicated movement between two points to deliver a shorter transit time than the normal surface line-haul movement (# e-way bills increased 13% between FY19-20) Notes: DFC= Dedicated Freight Corridor Sources: Press reviews, Primary discussions, Secondary research, PGA Labs analysis © PGA Labs | 15 Logistics and Transportation With a share of 67%, apparel and electronics are the largest categories in the e-commerce logistics market Apparel, electronics and home furnishing contribute 90% of e-commerce retail logistics Product-wise split of e-commerce logistics %, FY20 1% 3% 6% Others 23% Books Baby products 31% Home furnishing Electronics 36% Apparel E-commerce retail logistics E-commerce has the highest logistics cost as % of revenue at Logistics cost as a % of revenue FY20 As next/same day deliveries are becoming a norm in e-commerce, it is leading to high last-mile delivery costs and, in turn, high logistics costs 9.5% 6.0% 5.5% 5.5% 4.5% 4.5% Automotive E-commerce Consumer Organized Cars and UVs Two and three durables and FMCG retail components wheelers Sources: Secondary research, PGA Labs analysis, UV=Utility Vehicle © PGA Labs | 16 Logistics and Transportation Fueling the growth of the Indian e-commerce retail logistics sector Headwinds Tailwinds Cost pressures: Technological advancement: • India faces high logistics costs as • Automation, artificial intelligence, machine compared to developed countries driving learning, data analytics, and the Internet of e-commerce logistics firms to switch to Things (IoT) are significantly contributing to surface transit for deliveries increasing operational efficiency • In addition to the infrastructural • Decreasing the cost of technologies like cloud inefficiencies, the cost of delivery is driven computing, GPS trackers, IoT sensors, etc. is up by high return rates and a high share of also enabling small scale logistics companies to Cash on Delivery (COD) orders modernize their systems Return shipments: Digitization of payments: • Currently, the return rate for overall e-com • Increased adoption of digital payments had led retail is around 18-25%, driving up the to a reduction in cash handling requirement of logistics cost LSPs • The returned goods lead to the refund, • This has also led to a reduction in Cash on exchange, and replacement, increasing Delivery (CoD) transactions which is overall supply chain cost considered a challenge for logistics providers Inadequate infrastructure: Infrastructure modernization: • The Indian logistics industry is plagued • Dedicated freight corridors, free trade by the need for proper infrastructure for warehousing zones, logistics parks, and both air and surface transit leading to container freight stations are expected to inefficiency, longer transit times, higher improve the efficiency of the Indian logistics logistics costs, and higher returns market Readiness for rapidly growing cross border • The National Highways Development Project e-commerce industry: aims to expand India’s current expressway • Rise in international shipments driven network of 2000 km and plans to add 18,637 by an increase in online retail stores and km of greenfield expressways by 2022, and the growing cross border e-commerce Bharatmala project is aiming to construct market 83,677 km of highways by 2024 • Indian airports serve as a transfer hub Government initiatives: for various intercontinental routes but • Government initiatives such as National do not have the required infrastructure Infrastructure Pipeline, Sagarmala, and the to cater to growing international recently introduced National Monetization volumes Pipeline are expected to give a boost to the logistics market and substantially aid last-mile • This segment is still fragmented, and there delivery capabilities in India is less connectivity for Tier II and III cities with major cities for air transportation Sources: Secondary research, PGA Labs analysis © PGA Labs | 17 Logistics and Transportation Specialized LSPs and LSP consolidators offer a technology-led value proposition making them attractive segments Key opportunities Key challenges Overall attractiveness • Captive LSPs have established • Ability to address external • Low to moderate themselves as leaders by demand is limited because of attractiveness given the limited developing technology backed high captive requirement ability to diversify the demand solutions base • Significant demand • They can leverage their current fluctuations during monthly capabilities to address external and annual discount sales demand • Captive LSPs have • Ability to address external • High attractiveness gave the established themselves as demand is limited because ability to leverage the leaders by developing of high captive technology stack for sustained technology backed solutions requirement differentiation • They can leverage their • Significant demand • Strengthen the value current capabilities to fluctuations during proposition of e-commerce address external demand monthly and annual platforms through enhanced discount sales service to end customers • Demand drivers such as growth in D2C brands and new age commerce • Due to their long-standing • Technology capability is • Low attractiveness due to presence, they have the not mature enough to nascent capabilities for the physical network and address the bespoke needs e-commerce space relationships to address of e-commerce geographic coverage companies, specifically in terms of last-mile visibility • Traditional LSPs primarily cater to forward shipments only, reverse shipment is a business opportunity area • Significant headroom for • Limited control over • High attractiveness due to growth due to the ability to customer service and the strong value proposition offer competitive prices and a quality of delivery structured around pricing full-stack technology platform and technology-led solutions • Competitive threat from for data driven business LSPs developing • Demand drivers such as decisions capabilities for the growth in D2C brands and • The emergence of D2C brands e-commerce market new age commerce and new age commerce provides a strong lever for growth Low High Sources: Primary discussions, Secondary research , PGA Labs analysis © PGA Labs | 18 Logistics and Transportation India’s e-commerce logistics market landscape has evolved over the past few years, with new entrants in the specialized LSP and LSP consolidator space Captive LSPs Specialized LSPs Traditional LSPs LSP consolidators Notes: *CAGR calculated between FY17-19, ** CAGR calculated between FY18-20 Sources: Secondary research, Company websites, PGA Labs analysis © PGA Labs | 19 Logistics and Transportation Profile of key logistics players Founded 2011 2015 2017 2015 1991 2012 Headquarters Gurgaon, Delhi, Pune, Bangalore, Bangalore, Mumbai, India India India India India India Total funding Acquired by 1,370 176 21 101 260 (US$ M) DHL Key - investors Provider of Provider of Provider of Analytics driven App based Provider end-to-end end-to-end e-commerce logistics provider of courier and tech-enabled delivery fulfillment solutions last mile package Brief logistics services for solutions provider for delivery distribution description solution to e-commerce SMBs services services small and companies large e-commerce players Fulfillment, Fulfillment, Fulfillment, First mile, line Hyper local Courier first mile and first mile and first mile and haul and last & last mile delivery Business last mile last mile last mile mile deliveries delivery, through model warehousing surface and self owned air network Geographic 2 countries 1 country 1 country 1 country 1 country 220 countries presence Pin codes 27,000+ 17,000+ 20,000+ 4,000+ 7,000 14,000+ (in covered India) • Large • Large • Large • Large • Large • Large Customer mix • Medium • Medium • Medium • Medium • Medium • Medium Ability to High reach and Competitive Specialized in Experts in High service USP deliver in coverage pricing as warehousing & handling reliability difficult compared to fulfillment, reverse logis- due to robust terrains competitors services in tier 2 tics on-ground & 3 cities ops Sources: Secondary research, Company websites, Primary interviews, PGA Labs analysis © PGA Labs | 20 Logistics and Transportation Profile of key LSP consolidators Founded 2015 2016 2019 2015 2017 2012 Headquarters New Delhi, Gurgaon, Delhi, Gurgaon, Mumbai, Gurgaon, India India India India India India Total funding 102 16.4 1 - Undisclosed Unfunded (US$ M) Key - - investors Automated All in one Single AI – based Marketplace Shipping shipping shipping dashboard e-commerce for aggregator solution for solution for for all shipping e-commerce platform for Brief e-commerce e-commerce shipping solutions logistics e-commerce description needs business owners Hyper local, Fulfilment, first Express & Fulfilment and Express & fulfillment, mile and last mile surface shipping surface Business - first mile and delivery shipping shipping model last mile 220+ 200+ 220 25+ 200+ Geographic countries countries countries countries countries - presence Pin codes 29000 29000+ 27000+ 29000+ 26,000+ 20,000+ covered • Medium • Medium • Medium • Medium • Medium • Medium Customer • Small • Small • Small • Small • Small • Small mix • Post check- • Unique • Focused on • Providing • Highly • Search out platform dashboard with quality of warehousing focused on engine to including the flexibility to services than solutions as providing compare order choose delivery volumes well along personalized price experience partners based • Robust with key customer offerings management, upon the technology services service of USP delivery requirements platform provided by • Confirmation different management • Performance offering other LSP with delivery & communi- reports on various numerous consolidators consignee partners cations courier partners tech regarding the for a • 3-4 team persons integrations delivery of shipment assigned to each each client product(s) client ensured ensured high High service service levels levels Sources: Primary discussions, PGA Labs analysis © PGA Labs | 21 Our team Abhishek Maiti Kiran Achanta Arindam Gupta Industrial Good & Services, Technology & Internet Healthcare & life sciences Technology & Internet Roma Dixit Tarak Pandey Vamsi Krishna Financial Investor Group, Financial Services Technology & Internet Consumer & Retail Parul Garg Vaibhav Tamrakar Prasun Dey Consumer Fintech, Ed Tech & Food Tech Technology & Internet Praneet Singhal Abhilasha Jaju Bharanikaran Karunakaran Technology & Internet Financial Services Healthcare & life sciences We understand the LogisticsTech space very well and have experience in several pieces of deep research work • Conducted deep research on Logistics SaaS and its growth drivers in India • Estimated market size of e-commerce retail & D2C logistics space in India which act as the key growth drivers of e-commerce Logistics. Also, benchmarked key trends in D2C space in India • Mapped various Logistics supply chains and value chains from first-mile to last-mile including e-commerce logistics • Benchmarked critical metrics of competitor intelligence including delivery closure rates, % damaged shipment, % RTO shipment, etc. across major LogisticsTech players in India • Estimated trip economics for various value chain participants in transportation business across geos • Conducted deep supply side surveys / IDIs of truckers / DCOs (driver cum owners) • Also conducted deep demand side in-depth interviews to understand customers of Logistics aggregator platforms © PGA Labs | 22 Deep business research and intelligence that helps in driving SMARTER DECISIONS Deep on-ground insights that you can act on 4 offices, deep experience across geographies – India, US, Europe, MEA, and SEA region Advanced technology tools and innovative data gathering approach Multifaceted teams with a unique mixture of qualitative, quantitative, and digital research experts Connect with us We will be happy to share perspectives Abhishek Maiti Milan Banthiya Director Business Associate PGA Labs PGA Labs For media queries, please contact Vaishnav Kumar Rai Manager - Marketing E: communications@pgalabs.in M: +91 7838955743 www.pgalabs.in New Delhi | Gurugram | Mumbai | Bengaluru Disclaimer: This material has been prepared by PGA Labs, which is the trade name of Praxian Global Private Limited (“PGA”) with the intent to showcase our capability and disseminate learnings to potential partners/clients. This material can be referred to by the viewers on the internet but should be referenced to PGA Labs, if reused or adapted in any form or in any forum. The frameworks, approaches, tools, analysis and opinions are solely PGA’s intellectual property and are a combination of collection of best data we could find publicly, and PGA Labs team’s own experiences and observations. We make no representation or warranty, express or implied, that such information is accurate or complete, and nothing contained in here can be construed as definitive predictions or forecasts. Before reading further, the Recipient expressly agrees that this might not address any and all risks and challenges facing Recipient, its business and the markets within which it operates, nor all possible market conditions. No responsibility or liability whatsoever is accepted by any person including PGA or its Business partners and affiliates and their respective officers, employees or agents for any errors or omissions in this document. Any and all logos of companies used in the post have been published for information purposes only and PGA Labs does not hold any and all liability in connection therewith. This document is not complete without an accompanying oral discussion and presentation by PGA though PGA is not obligated to do so. PGA does not have any duty to update or supplement any information in this document. PGA shall not be responsible for any loss sustained by any person who relies on this presentation. The team at PGA Labs appreciates your time and support THANK YOU We enable better decision making. New Delhi Gurugram Mumbai Bengaluru Unit 5, Ground Floor, CP-003, 004, 112, First floor, 2734, Fourth floor, Uppal Plaza M6, District GF Tower 4B, DLF Workafella, AK Estate, HSR Layout, Sector 1, Centre, Jasola -110 025 Corporate Park, Goregaon West, 27th Main, 16th Cross, New Delhi, India Gurugram -122 002 Mumbai - 400 062 Bengaluru - 560 102 Haryana, India Maharashtra, India Karnataka, India Registered address: Praxian Global Pvt. Ltd., Unit 5, Ground Floor, Uppal Plaza M6, District Centre, Jasola, New Delhi -110025